Translations available:
Czech
|
French
|
Japanese
|
Spanish
Why Open Source Software / Free Software (OSS/FS, FLOSS, or FOSS)? Look at the Numbers!
David A. Wheeler
http://www.dwheeler.com/contactme.html
Revised as of May 9, 2005
This paper provides quantitative data that, in many cases, using
open source software / free software
(abbreviated as OSS/FS, FLOSS, or FOSS)
is a reasonable or even superior approach
to using their proprietary competition according to various measures.
This paper’s goal is to show that you should consider using OSS/FS
when acquiring software.
This paper examines
market share,
reliability,
performance,
scalability,
security, and
total cost of ownership.
It also has sections on
non-quantitative issues,
unnecessary fears,
OSS/FS on the desktop,
usage reports,
governments and OSS/FS,
other sites providing related information,
and ends with some
conclusions.
An appendix gives more background information about
OSS/FS.
You can view this paper at
http://www.dwheeler.com/oss_fs_why.html (HTML format).
Palm PDA users may wish to use
Plucker to view this.
A short briefing based on this paper is also available in
PDF
and
OpenOffice.org Impress formats
(for the latter, use OpenOffice.org Impress).
Old archived copies and a list
of changes are
also available.
Open Source Software / Free Software (OSS/FS)
(also abbreviated as FLOSS or FOSS)
has risen to great prominence.
Briefly, OSS/FS programs are programs whose licenses give
users the freedom to run the program for any purpose,
to study and modify the program, and to redistribute copies of
either the original or modified program (without having to pay
royalties to previous developers).
The goal of this paper is to convince you
to consider using OSS/FS when you’re looking
for software, using quantitive measures.
Some sites provide a few anecdotes on why you should use OSS/FS, but
for many that’s not enough information to justify using OSS/FS.
Instead, this paper emphasizes quantitative measures
(such as experiments and market studies) to justify why
using OSS/FS products is in many circumstances
a reasonable or even superior approach.
I should note that while I find much to like about OSS/FS, I’m not a
rabid advocate; I use both proprietary and OSS/FS products myself.
Vendors of proprietary products often work hard to find numbers to support
their claims; this page provides a useful antidote of hard figures to
aid in comparing proprietary products to OSS/FS.
I believe that this paper has met its goal; others seem to think so too.
The 2004 report of the California Performance Review,
a report from the state of California, urges that
“the state should more extensively consider
use of open source software”,
and specifically references this paper.
A review at the
Canadian Open Source Education and Research (CanOpenER) site stated
“This is an excellent look at the some of the reasons why
any organisation should consider the use of [OSS/FS]...
[it] does a wonderful job of bringing the facts and figures of
real usage comparisons and how the figures are arrived at.
No FUD or paid for industry reports here, just the facts”.
This paper been referenced by many other works, too.
It’s my hope that you’ll find it useful as well.
The following subsections describe the paper’s
scope,
challenges in creating it,
the paper’s
terminology,
and the
bigger picture.
This is followed
by a description of the
rest of the paper’s organization (listing the sections such as
market share,
reliability,
performance,
scalability,
security, and
total cost of ownership).
Those who find this paper interesting may also be interested in the
other documents available on
David A. Wheeler’s personal home page.
As noted above,
the goal of this paper is to convince you
to consider using OSS/FS when you’re looking
for software, using quantitive measures.
Note that this paper’s goal is not to show that all OSS/FS is
better than all proprietary software.
Certainly, there are many who believe this is true from
ethical, moral,
or social grounds.
It’s true that OSS/FS users have fundamental
control and flexibility advantages, since they can modify
and maintain their own software to their liking.
And some countries perceive advantages to
not being dependent on a sole-source company based in another country.
However, no numbers could prove the broad claim that OSS/FS is always
“better” (indeed you cannot reasonably
use the term “better” until you determine what you
mean by it).
Instead, I’ll simply compare commonly-used OSS/FS software with
commonly-used proprietary software, to show that at least in certain
situations and by certain measures, some OSS/FS software is
at least as good or better than its proprietary competition.
Of course, some OSS/FS software is technically poor, just as
some proprietary software is technically poor.
And remember -- even very good software may not fit your specific needs.
But although most people understand the need to compare proprietary
products before using them, many people fail to even consider OSS/FS products,
or they create policies that unnecessarily inhibit their use;
those are errors this paper tries to correct.
This paper doesn’t describe how to evaluate particular OSS/FS programs;
a companion paper
describes how to evaluate OSS/FS programs.
This paper also doesn’t explain how an organization would transition to
an OSS/FS approach if one is selected.
Other documents cover transition issues, such as
The Interchange of Data between Adminisrations (IDA)
Open Source Migration Guidelines (November 2003)
and the German
KBSt’s Open Source Migration Guide (July 2003)
(though both are somewhat dated).
Organizations can transition to OSS/FS in part or in
stages, which for many is a more practical transition approach.
I’ll emphasize the operating system (OS) known as
GNU/Linux (which many abbreviate as
“Linux”),
the
Apache web server, the
Mozilla Firefox web browser, and the
OpenOffice.org office suite,
since these are some of the most visible OSS/FS projects.
I’ll also primarily compare OSS/FS software to Microsoft’s
products (such as Windows and IIS), since Microsoft Windows has a
significant market share and Microsoft is one of proprietary software’s
strongest proponents.
Note, however, that even Microsoft makes and uses OSS/FS themselves
(they have even
sold software using the GNU GPL license,
as discussed below).
I’ll mention Unix systems as well, though the situation with
Unix is more complex; today’s Unix systems include many OSS/FS
components or software primarily derived from OSS/FS components.
Thus, comparing proprietary Unix systems to OSS/FS systems
(when examined as whole systems) is often not as clear-cut.
This paper uses the term “Unix-like” to mean
systems intentionally similar to Unix;
both Unix and GNU/Linux are “Unix-like” systems.
The most recent Apple Macintosh OS (MacOS OS X)
presents the same kind of complications;
older versions of MacOS were wholly proprietary, but
Apple’s OS has been redesigned so that it’s now
based on a Unix system with substantial contributions from OSS/FS programs.
Indeed, Apple is now
openly encouraging collaboration with OSS/FS developers.
It’s a challenge to write any paper like this; measuring anything
is always difficult, for example.
Most of these figures are from other works, and it was
difficult to find many of them.
But there are two special challenges
that you should be aware of: legal problems in publishing data, and
dubious studies -- typically those funded by a product vendor.
Many
proprietary software product licenses include clauses that
forbid public criticism of the product
without the vendor’s permission.
Obviously, there’s no reason that such permission would be granted if
a review is negative -- such vendors can
ensure that any negative comments are reduced and that harsh
critiques, regardless of their truth, are never published.
This significantly reduces the amount of information available
for unbiased comparisons.
Reviewers may choose to change their report so it can be published (omitting
important negative information), or not report at all -- in fact,
they might not even start the evaluation.
Some laws, such as UCITA
(a law in Maryland and Virginia),
specifically enforce these clauses forbidding free speech, and in many other
locations the law is unclear -- making researchers bear substantial
legal risk that these clauses might be enforced.
These legal risks have a chilling effect on researchers, and thus
makes it much harder for customers to receive complete unbiased information.
This is not merely a theoretical problem;
these license clauses have already prevented some public critique,
e.g., Cambridge researchers reported that
they
were forbidden to publish some of their benchmarked results
of VMWare ESX Server and Connectix/Microsoft Virtual PC.
Oracle has had such clauses for years.
Hopefully these unwarranted restraints of free speech will be
removed in the future.
But in spite of these legal tactics to prevent disclosure of unbiased data,
there is still some publicly available data, as this paper shows.
This paper omits or at least tries to warn about studies
funded by a product’s vendor, which have a fundamentally
damaging conflict of interest.
Remember that
vendor-sponsored
studies are often rigged
(no matter who the vendor is)
to make the vendor look good instead of being fair comparisons.
Todd Bishop’s January 27, 2004 article in the
Seattle Post-Intelligencer Reporter discusses the
serious problems when a vendor funds published research about itself.
A study funder could directly pay someone and ask them to directly lie,
but it’s not necessary; a smart study funder can produce the
results they wish without, strictly speaking, lying.
For example, a study funder can make sure that the evaluation
carefully defines a specific environment or extremely
narrow question that shows a positive trait of their product
(ignoring other, probably more important factors),
require an odd measurement process that happens show off their product,
seek unqualified or unscrupulous reviewers who will create positive
results (without careful controls or even without doing the work!),
create an unfairly different environment between the compared products
(and not say so or obfuscate the point),
require the reporter to omit any especially negative results,
or even fund a large number of different studies and only allow the positive
reports to appear in public.
(A song by Steve Taylor expresses these kinds of approaches eloquently:
“They can state the facts while telling a lie”.)
This doesn’t mean that all vendor-funded studies are misleading, but
many are, and there’s no way to be sure which studies (if any)
are actually valid.
For example, Microsoft’s “get the facts” campaign
identifies many studies, but nearly every study is entirely vendor-funded,
and I have no way to determine if any of them are valid.
After a pair of vendor-funded studies were publicly lambasted,
Forrester
Research announced that it will no longer accept projects
that involve paid-for, publicized product comparisons.
One ad, based on a vendor-sponsored study, was
found to be misleading by the UK
Advertising Standards Authority (an independent, self-regulatory body), who
formally adjudicated against the vendor.
This example is important because the study was touted as being fair
by an “independent” group, yet it was found unfair
by an organization who
examines advertisements; failing to meeting the standard for truth for an
advertisement is a very low bar.
Steve Hamm’s BusinessWeek article “The Truth about Linux and Windows”
(April 22, 2005) noted that far too many reports are simply funded by
one side or another, and even when they say they aren’t,
it’s difficult to take some seriously.
In particular, he analyzed a report by the Yankee Group’s
Laura DiDio, asking deeper questions
about the data, and found many serious problems.
His article explained why he just doesn’t “trust its conclusions”
because “the work seems sloppy [and] not reliable”
(
a Groklaw article also discussed these problems).
Many companies fund studies that place their products in a good light,
not just Microsoft, and the concerns about vendor-funded studies
apply equally to vendors of OSS/FS products.
I’m independent; I have received no funding of any kind to
write this paper, and I have no financial reason to prefer either OSS/FS
or proprietary software.
This paper includes data over a series of years, not just the past year;
all relevant data should be considered when making a
decision, instead of arbitrarily ignoring older data.
Note that the older data shows that OSS/FS has a history
of many positive traits, as opposed to being a temporary phenomenon.
You can see more detailed explanation of the
terms “open source software”
and “Free Software”, as well as related information, in
the appendix
and my
list of
Open Source Software / Free Software (OSS/FS) references at
http://www.dwheeler.com/oss_fs_refs.html.
Note that those who use the term
“open source software” tend to emphasize
technical advantages of such software
(such as better reliability and security), while those who use the term
“Free Software” tend to emphasize freedom from control by another and/or ethical issues.
The opposite of OSS/FS is “closed” or
“proprietary” software.
Other alternative terms for OSS/FS software include
“libre software” (where libre means free as in freedom),
“livre software” (same thing),
free-libre and open-source software (FLOS software or FLOSS),
open source / Free Software (OS/FS),
free / open source software (FOSS),
open-source software (indeed, “open-source” is often used as a
general adjective),
“freed software,” and even
“public service software” (since often these
software projects are designed to serve the public at large).
Software that cannot be modified and redistributed without further limitation,
but whose source code is visible
(e.g., “source viewable” or “open box” software,
including
“shared source” and “community” licenses),
is not considered here
since such software don’t meet the definition of OSS/FS.
OSS/FS is not “freeware”; freeware is usually defined as
proprietary software given away without cost, and
does not provide the basic OSS/FS rights to examine, modify, and redistribute
the program’s source code.
A few writers still make the mistake of saying that OSS/FS is
“non-commercial” or “public domain”, or they mistakenly contrast OSS/FS with
“commercial” products.
However, today many OSS/FS programs are commercial programs,
supported by one or many for-profit companies, so this
designation is quite wrong.
Don’t make the mistake of thinking OSS/FS is equivalent
to “non-commercial” software!
Also,
nearly all OSS/FS programs are not in the public domain.
the term “public domain software” has a specific legal meaning --
software that has no copyright owner -- and that’s not true in most cases.
In short, don’t use the terms “public domain” or “non-commercial”
as synonyms for OSS/FS.
An OSS/FS program must be released under some license giving its
users a certain set of rights;
the most popular OSS/FS license is the GNU General Public License (GPL).
All software released under the GPL is OSS/FS, but not all OSS/FS software
uses the GPL; nevertheless, some people do inaccurately use the term
“GPL software” when they mean OSS/FS software.
Given the GPL’s dominance, however, it would be fair to say that any
policy that discriminates against the GPL discriminates against OSS/FS.
This is a large paper, with many acronyms.
A few of the most common acryonyms are:
| Acronym | Meaning |
|---|
| GNU | GNU’s Not Unix (a project to create an OSS/FS operating system) | |
| GPL | GNU General Public License (the most common OSS/FS license) |
| OS, OSes | Operating System, Operating Systems |
| OSS/FS | Open Source Software/Free Software |
This paper uses
logical
style quoting
(as defined by Hart’s Rules and the Oxford Dictionary for Writers and Editors);
quotations do not include extraneous punctuation.
Typical OSS/FS projects are, in fact, an example of something much larger:
commons-based peer-production.
The fundamental characteristic of OSS/FS is its licensing, and
an OSS/FS project that meets at least one customer’s need can be
considered a success,
However, larger OSS/FS projects are typically developed by many
people from different organizations working together for a common goal.
As the declaration
Free Software Leaders Stand Together states, the business model
of OSS/FS “is to reduce the cost of software development and maintenance
by distributing it among many collaborators”.
Yochai Benkler’s 2002 Yale Law Journal article,
“Coase’s Penguin, or Linux and the Nature of the Firm”
argues that OSS/FS development is only one example of the broader
emergence of a new, third mode of production in
the digitally networked environment.
He calls this approach “commons-based peer-production”
(to distinguish it from the property- and contract-based models
of firms and markets).
Many have noted that OSS/FS approaches can be applied to many
other areas, not just software.
The Internet encyclopedia Wikipedia,
and works created using
Creative Commons licenses
(Yahoo! can search for these),
are other examples of this development approach.
Wide Open: Open source methods and their future potential
by Geoff Mulgan (who once ran the policy unit at 10 Downing Street),
Tom Steinberg, and with Omar Salem, discusses this wider potential.
Many have observed that the process of creating scientific knowledge has
worked in a similar way for centuries.
OSS/FS is also an example of the incredible value that can result
when users have the
freedom to tinker
(the freedom to understand, discuss, repair, and modify
the technological devices they own).
Innovations are often created by combining pre-existing components
in novel ways, which generally requires that users be able to
modify those components.
This freedom is, unfortunately, threatened by various laws and
regulations such as the U.S. DMCA, and the FCC “broadcast flag”.
It’s also threatened by efforts such as
“trusted computing” (often called “treacherous computing”),
whose goal is to create systems in which external organizations,
not computer users, command complete control
over a user’s computer
(BBC News
among others is concerned about this).
Lawrence Lessig’s
Code and Other Laws of Cyberspace
argues that software code has the same role in cyberspace as law does
in realspace.
In fact, he simply argues that “code is law”, that is, that
as computers are becoming increasingly embedded in our world, what
the code does, allows, and prohibits, controls what we may or may not do
in a powerful way.
In particular he discusses the implications of “open code”.
All of these issues are beyond the scope of this paper, but the
referenced materials may help you find more information if
you’re interested.
Below is data discussing
market share,
reliability,
performance,
scalability,
security, and
total cost of ownership.
I close with a brief discussion of
non-quantitative issues,
unnecessary fears,
OSS/FS on the desktop,
usage reports,
other sites providing related information, and
conclusions.
A closing
appendix gives more background information about
OSS/FS.
Each section has many subsections or points.
The non-quantitative issues section includes discussions about
freedom from control by another (especially a
single source),
protection from licensing litigation,
flexibility,
social / moral / ethical issues, and
innovation.
The unnecessary fears section discusses issues such as
support,
legal rights,
copyright infringement,
abandonment,
license unenforceability,
GPL “infection”,
economic non-viability,
starving programmers
(i.e., the
rising commercialization of OSS/FS),
compatibility with capitalism,
elimination of competition,
elimination of “intellectual property”,
unavailability of software,
importance of source code access,
an anti-Microsoft campaign, and
what’s the catch.
And the appendix discusses
definitions of OSS/FS,
motivations of developers and developing companies,
history,
licenses,
OSS/FS project management approaches, and
forking.
Many people think that a product is only a winner if it has significant
market share.
This is lemming-like, but there’s some rationale for this: products
with big market shares get
applications, trained users, and momentum that reduces future risk.
Some writers argue against OSS/FS or GNU/Linux as “not being mainstream”,
but if their use is widespread then such statements reflect the past,
not the present.
There’s excellent evidence that
OSS/FS has significant market share in numerous markets:
-
The most popular web server has always been OSS/FS
since such data have been collected.
For example, Apache is
the #1 web server with over three times the market share of its next-ranked
(proprietary) competitor.
Netcraft’s statistics on web servers
have consistently shown Apache (an OSS/FS web server) dominating
the public Internet web server market ever since Apache
grew into the #1 web server in April 1996.
Before that time, the NCSA web server (Apache’s ancestor)
dominated the web from August 1995 through March 1996 - and it is also OSS/FS.
Netcraft’s survey published January 2005 (covering results from
December 2004)
polled all the web sites they could find
(totaling 58,194,836 sites), and found that of
all the sites they could find, counting by name,
Apache had 68.43% of the market,
Microsoft had 20.86%,
Sun had 3.14%, and
Zeus had 1.19%.
Apache’s share is increasing; all others’ market share is decreasing.
Market Share for Web Servers Across All Domains, October 1995 - January 2005
However, many web sites
have been created that are simply “placeholder” sites
(i.e., their domain names have been reserved but they are not being used);
such sites are termed “inactive.”
Thus, since 2000, Netcraft has been separately counting
“active” web sites.
Netcraft’s count of only the
active sites is arguably a more relevant figure than counting all web sites,
since the count of active sites shows
the web server selected by those who choose to actually develop a web site.
Apache does extremely well when counting active sites; in their
January 2005 (surveying December 2004),
Apache had 69.70% of the web server market,
Microsoft had 22.70%,
Zeus had 0.89%, and
Sun had 0.79%.
Apache gained market share; all others lost market share or stayed even.
Here is the total market share (by number of active web sites):
Market Share for Active Web Servers, June 2000 - January 2005
Netcraft’s September 2002 survey reported on
websites based on their “IP address” instead of the host name;
this has the effect of removing
computers used to serve multiple sites and sites with multiple names.
When counting by IP address, Apache has shown a slow increase
from 51% at the start of 2001 to 54%, while
Microsoft has been unchanged at 35%.
Again, a clear majority.
CNet’s
”Apache
zooms away from Microsoft’s Web server” summed up the year 2003
noting that
“Apache grew far more rapidly in 2003 than its nearest rival,
Microsoft’s Internet Information Services (IIS),
according to a new survey--meaning that the
open-source software remains by far the most widely
used Web server on the Internet.”
The same happened in 2004, in fact, in just December 2004 Apache gained
a full percentage point over Microsoft’s IIS among the total number of
all web sites.
Apache’s dominance in the web server market
has been independently confirmed by
Security Space -
their report on web server market share
published January 1, 2005 surveyed 20,725,323 web servers in December 2004 and
found that Apache was #1 (74.67%), with Microsoft IIS being #2 (17.92%).
E-soft also reports specifically on secure servers (web servers supporting
SSL/TLS, such as e-commerce sites); while much closer, Apache still leads with
50.55% market share, as compared to Microsoft’s
40.69%, Netscape/iPlanet’s 2.11%, and Stronghold’s 0.59%.
Since Stronghold is a repackaging of Apache, Apache’s real market
share is at least 51.14%.
Obviously these figures fluctuate monthly; see
Netcraft and
E-soft for the
latest survey figures.
-
GNU/Linux is the #2 web serving OS on the public Internet
(counting by physical machine), according to a study by Netcraft
surveying March and June 2001.
Some of Netcraft’s
surveys have also included data on OSes;
two 2001 surveys
(their
June 2001 and
September 2001
surveys) found that GNU/Linux is the #2 OS
for web servers when counting physical machines (and has been consistently
gaining market share since February 1999).
As Netcraft themselves point out,
the usual Netcraft web server survey (discussed above)
counts web server hostnames rather than physical computers,
and so it doesn’t measure such things as the installed hardware base.
Companies can run several thousand web sites on one computer,
and most of the world’s web sites are located at hosting
and co-location companies.
Therefore, Netcraft developed a technique that
indicates the number of actual computers being used as Web servers,
together with the OS and web server software used
(by arranging many IP addresses to reply to Netcraft
simultaneously and then analyzing the responses).
This is a statistical approach, so
many visits to the site are used over a month to build up sufficient certainty.
In some cases, the OS detected
is that of a “front” device rather than the web server actually
performing the task.
Still, Netcraft believes that the
error margins world-wide are well within the order of plus or minus 10%,
and this is in any case the best available data.
Before presenting the data, it’s important to explain Netcraft’s
system for dating the data.
Netcraft dates their information based on the web server
surveys (not the publication date), and they only report OS
summaries from an earlier month.
Thus, the survey dated “June 2001” was published in July and
covers OS survey results of March 2001, while the survey
dated “September 2001” was published in October and covers the operating
system survey results of June 2001.
Here’s a summary of Netcraft’s study results:
| OS group | Percentage (March) | Percentage (June) | Composition |
|---|
| Windows | 49.2% | 49.6% | Windows 2000, NT4, NT3, Windows 95, Windows 98 |
| [GNU/]Linux | 28.5% | 29.6% | [GNU/]Linux |
| Solaris | 7.6% | 7.1% | Solaris 2, Solaris 7, Solaris 8 |
| BSD | 6.3% | 6.1% | BSDI BSD/OS, FreeBSD, NetBSD, OpenBSD |
| Other Unix | 2.4% | 2.2% | AIX, Compaq Tru64, HP-UX, IRIX, SCO Unix, SunOS 4 and others |
| Other non-Unix | 2.5% | 2.4% | MacOS, NetWare, proprietary IBM OSes |
| Unknown | 3.6% | 3.0% | not identified by Netcraft OS detector |
Much depends on what you want to measure.
Several of the BSDs
(FreeBSD, NetBSD, and OpenBSD) are OSS/FS as well;
so at least a part of the 6.1% for BSD should be added to GNU/Linux’s
29.6% to determine the percentage of OSS/FS OSes being used
as web servers.
Thus, it’s likely that approximately one-third of
web serving computers use OSS/FS OSes.
There are also regional differences, for example,
GNU/Linux leads Windows in Germany, Hungary, the Czech Republic, and
Poland.
Well-known web sites using OSS/FS include
Google (GNU/Linux) and
Yahoo (FreeBSD).
If you really want to know about the web server market breakdown of
“Unix vs. Windows,” you can find that also in this study.
All of the various Windows OSes are rolled into a single number
(even Windows 95/98 and Windows 2000/NT4/NT3 are merged,
although they are fundamentally very different systems).
Merging all the Unix-like systems in a similar way
produces a total of 44.8% for Unix-like systems (compared
to Windows’ 49.2%) in March 2001.
Note that these figures would probably be quite different if they were
based on web addresses instead of physical computers; in such a case,
the clear majority of web sites are hosted by Unix-like systems.
As stated by Netcraft,
“Although Apache running on various Unix systems runs more sites than Windows,
Apache is heavily deployed at hosting companies and ISPs who strive
to run as many sites as possible on one computer to save costs.”
-
GNU/Linux is the #1 server OS on the public Internet (counting by
domain name), according to a 1999 survey of primarily European and
educational sites.
The first study that I’ve found that examined GNU/Linux’s market penetration
is a survey by
Zoebelein in April 1999.
This survey
found that, of the total number of servers deployed on the Internet in 1999
(running at least ftp, news, or http (WWW)) in a database of names they used,
the #1 OS was
GNU/Linux (at 28.5%), with others trailing.
It’s important to note that this survey, which is the first one that
I’ve found to try to answer questions of market share,
used existing databases of servers
from the .edu (educational domain) and the RIPE database
(which covers Europe , the Middle East, parts of Asia, and parts of Africa),
so this isn’t really a survey of “the whole
Internet” (e.g., it
omits “.com” and “.net”).
This is a count by domain name (e.g., the text name you would type
into a web browser for a location) instead of by physical
computer, so what it’s
counting is different than the Netcraft June 2001 OS study.
Also, this study counted servers providing ftp and news services
(not just web servers).
Here’s how the various OSes fared in the study:
| Operating System | Market Share | Composition |
|---|
| GNU/Linux | 28.5% | GNU/Linux |
| Windows | 24.4% | All Windows combined (including 95, 98, NT) |
| Sun | 17.7% | Sun Solaris or SunOS |
| BSD | 15.0% | BSD Family (FreeBSD, NetBSD, OpenBSD, BSDI, ...) |
| IRIX | 5.3% | SGI IRIX |
A part of the BSD family is also OSS/FS, so the OSS/FS OS
total is even higher; if over 2/3 of the BSDs are OSS/FS, then the total
share of OSS/FS would be about 40%.
Advocates of Unix-like systems
will notice that the majority (around 66%) were running Unix-like
systems, while only around 24% ran a Microsoft Windows variant.
-
GNU/Linux was the #2 server OS sold in 1999, 2000,
and 2001.
According to
a June 2000 IDC
survey of 1999 licenses,
24% of all servers (counting both Internet and intranet servers)
installed in 1999 ran GNU/Linux.
Windows NT came in first with 36%;
all Unixes combined totaled 15%.
Again, since some of the Unixes are OSS/FS systems (e.g., FreeBSD, OpenBSD,
and NetBSD), the number of OSS/FS systems is actually larger than the
GNU/Linux figures.
Note that it all depends on what you want to count;
39% of all servers installed from this survey
were Unix-like (that’s 24%+15%), so
“Unix-like” servers were actually #1 in installed market share
once you count GNU/Linux and Unix together.
IDC released a similar study on January 17, 2001 titled
“Server Operating Environments: 2000 Year in Review”.
On the server, Windows accounted for 41% of new server OS sales
in 2000, growing by 20% - but GNU/Linux accounted for 27%
and grew even faster, by 24%.
Other major Unixes had 13%.
IDC’s 2002 report found that Linux held its own in 2001 at 25%.
All of this is especially intriguing since GNU/Linux had 0.5% of the
market in 1995,
according
to a Forbes quote of IDC.
Data such as these (and the TCO data shown later)
have inspired statements such as
this one from IT-Director on November 12, 2001:
“Linux on the desktop is still too early to call, but
on the server it now looks to be unstoppable.”
These measures do not measure all server systems installed that year;
some Windows systems are copies that have not been paid for
(sometimes called pirated software), and
OSS/FS OSes such as GNU/Linux and the BSDs
are often downloaded and installed on multiple systems
(since it’s legal and free to do so).
Note that
a study published October 28, 2002 by the IT analyst company Butler Group
concluded that on or before 2009,
Linux and Microsoft’s .Net will have fully penetrated the server OS
market from file and print servers through to the mainframe.
-
GNU/Linux and Windows systems (when Windows CE and XP are combined)
are the leaders and essentially even in terms of developer
use for future embedded projects, according to Evans Data Corporation (EDC).
Their Embedded Systems Developer Survey, fielded
in July 2002, asked developers
“For each of the following operating systems,
please indicate whether you are targeting the OS on your current project
or your next project.”
They collected data from 444 developers.
Their results: 30.2% of embedded developers use or expect to use Linux,
while 16.2% say they will use Windows CE and another 14.4% say they will
use Windows XP Embedded.
If the two Windows systems are combined, this gives
Windows Embedded operating systems a statistically insignificant
edge over Embedded Linux (at 30.6% vs. 30.2%).
However, Embedded Linux has nearly double the growth rate, and
combining two different Windows systems into a single value is somewhat
misleading.
Wind River’s VxWorks embedded OS,
the current embedded software market leader,
“trails slightly behind Embedded Linux for current project use,
and VxWorks’ modest gain of just 2.9% for expected use in future projects
drops it to a distant third place position,
ending up with less than half the usage rate of the two neck-and-neck
future project usage leaders (Windows Embedded and Embedded Linux).”
-
An Evans Data survey published in November 2001
found that 48.1% of international developers and 39.6% of North Americans
plan to target most of their applications to GNU/Linux.
In October 2002, they found that 59% of developers
expect to write Linux applications in the next year.
The
November 2001 edition of the
Evans Data International Developer Survey Series
reported on in-depth interviews with over 400 developers
representing over 70 countries,
and found that when asked
which OS they plan to target with
most of their applications next year,
48.1% of international developers and 39.6% of North Americans
stated that they plan to target most of their applications to GNU/Linux.
This is surprising since
only a year earlier less than a third of
the international development community was writing GNU/Linux applications.
The survey also found that
37.8% of the international development community
and 33.7% of North American developers
have already written applications for GNU/Linux, and that
over half of those surveyed have enough confidence in GNU/Linux
to use it for mission-critical applications.
Evans Data
conducted a survey in October 2002.
In this survey, they reported
“Linux continues to expand its user base.
59% of survey respondents expect to write Linux applications in the next year.”
-
An Evans Data survey made public in February 2004
found that 1.1 million developers in North America were working
on OSS/FS projects.
Evans Data’s North American Developer Population Study
examined the number of software developers using various approaches.
It found that more than 1.1 million developers
in North America were spending at least some of their
time working on Open Source development projects.
That’s an extraordinarily large number of people, and it doesn’t even
account for developers in other countries.
Many only develop part-time, but that many people can develop a lot of
software, and having a large number of people increases the likelihood
of helpful insights and innovations in various OSS/FS projects.
-
A 2004 InformationWeek survey found that 67% of companies
use OSS/FS products, with another 16% expecting to use it in 2005;
only 17% have no near-term plans to support OSS/FS products.
The November 1, 2004 InformationWeek article
Open-Source Software Use Joins The Mix
by Helen D’Antoni reported the results from
InformationWeek Research, which
measured adoption of “open-source architecture”
and found that adoption is widespread.
The survey also found other interesting results:
“In general, companies don’t view open-source software as risky.
It often functions alongside
[proprietary] and internally developed software,
and because of this acceptance, open-source code is being used more broadly.
Its use is evolving as companies look for cost-effective ways
to manage software expenses.”
Of those companies using OSS/FS,
they found that 42% of
companies implement production database operations using OSS/FS,
with 33% more considering it;
only 25% are not using or considering OSS/FS for production database use.
- A Japanese survey found widespread use and support for GNU/Linux;
overall use of GNU/Linux jumped from 35.5% in 2001 to 64.3% in 2002 of
Japanese corporations, and GNU/Linux was the most popular platform for
small projects.
The book
Linux White Paper 2003
(published by Impress Corporation) surveys the use of GNU/Linux
in Japan (it is an update to an earlier book,
“Linux White Paper 2001-2002”).
This is written in Japanese; here is a brief summary of its contents.
The survey has two parts, user and vendor. In “Part I : User enterprise”,
they surveyed 729 enterprises that use servers.
In “Part II : Vendor enterprise”,
they surveyed 276 vendor enterprises
who supply server computers, including system
integrators, software developers, IT service suppliers, and hardware resellers.
The most interesting results are those that discuss the use of Linux servers
in user enterprises, the support of Linux servers by vendors,
and Linux server adoption in system integration projects.
First, the use of Linux servers in user enterprises:
| System | 2002 | 2001 |
|---|
| Linux server | 64.3% | 35.5% |
| Windows 2000 Server | 59.9% | 37.0% |
| Windows NT Server | 64.3% | 74.2% |
| Commercial Unix server | 37.7% | 31.2% |
And specifically, here’s the average use in 2002:
| System | Ave. units | # samples |
|---|
| Linux server | 13.4 | N=429 (5.3 in 2001) |
| Windows 2000 Server | 24.6 | N=380 |
| Windows NT Server | 4.5 | N=413 |
| Commercial Unix server | 6.9 | N=233 |
Linux servers are the fastest growing category from last year.
The average units of server per enterprise increased by
2.5-fold from 5.3 units to 13.4 units.
Second, note the support of GNU/Linux servers by vendors:
| System | Year 2002 Support |
|---|
| Windows NT/2000 Server | 66.7% |
| Linux server | 49.3% |
| Commercial Unix server | 38.0% |
This is the rate of vendors that develop or sale products supporting
Linux server; note that Linux is already a major OS when compared
with its competitors. The reasons for supporting Linux server
were also surveyed, which turn out to be different than the
reasons in some other counties (for a contrast, see the
European FLOSS report):
| Increase of importance in the future | 44.1% |
| Requirement from their customers | 41.2% |
| Major OS in their market | 38.2% |
| Free of licence fee | 37.5% |
| Most reasonable OS for their purpose | 36.0% |
| Open source | 34.6% |
| High reliability | 27.2% |
Third, note the rate of Linux server adoption in system integration projects:
| Project Size (Million Yen) | Linux | Win2000 | Unix |
|---|
| | 2002 | 2001 | 2002 | 2002 |
|---|
| 0-3 | 62.7% | 65.7% | 53.8% | 15.4% |
| 3-10 | 51.5% | 53.7% | 56.3% | 37.1% |
| 10-50 | 38.3% | 48.9% | 55.8% | 55.8% |
| 50-100 | 39.0% | 20.0% | 45.8% | 74.6% |
| 100+ | 24.4% | 9.1% | 51.1% | 80.0% |
Where 1 Million Yen = $8,000 US.
GNU/Linux servers are No.1 (62.5%) in small projects less than
3,000,000 Yen ($24,000 US), and
GNU/Linux has grown in larger projects more
than 50,000,000 Yen ($400,000 US) from 20.0% to 39.0%.
In projects over 100,000,000 Yen ($800,000 US), Linux is adopted by
24.4% of the projects (mainly as a substitute for proprietary Unix systems).
Note that many projects (especially large ones) use multiple platforms
simultaneously, so the values need not total 100%.
Note that the Japanese
Linux white paper 2003
found that 49.3% of IT solution vendors support Linux in Japan.
-
The European FLOSS study found significant use of OSS/FS.
The large report
Free/Libre and
Open Source Software (FLOSS): Survey and Study,
published in June 2002, examined many issues including
the use of OSS/FS.
This study found significant variance in the use of OSS/FS;
43.7% of German establishments reported using OSS/FS,
31.5% of British establishments reported using OSS/FS, while only
17.7% of Swedish establishments reported using OSS/FS.
In addition, they found that OSS usage rates of larger establishments
were larger than smaller establishments, and that OSS usage rates
in the public sector were above average.
-
Microsoft sponsored its own research to “prove” that
GNU/Linux is not as widely used, but this research has been shown to
be seriously flawed.
Microsoft sponsored a
Gartner Dataquest report claiming only 8.6% of servers shipped in
the U.S. during the third quarter of 2000 were Linux-based.
However, it’s worth noting that Microsoft (as the research sponsor)
has every incentive to create low numbers, and these numbers are quite
different from IDC’s research in the same subject.
IDC’s Kusnetzky
commented that the likely explanation is that Gartner used a very
narrow definition of “shipped”; he thought the number was
“quite reasonable” if it only surveyed new servers with Linux,
“But our research is that this is not how most users get their Linux.
We found that just 10 to 15 percent of Linux adoption comes from
pre-installed machines... for every paid copy
of Linux, there is a free copy that can be replicated 15 times.”
Note that it’s quite difficult to buy a new x86 computer without a
Microsoft OS (Microsoft’s contracts with computer makers
ensure this), but that doesn’t mean that these OSes are used.
Gartner claimed that it used interviews to counter this problem, but
its final research results (when compared to known facts) suggest that
Gartner did not really counter this effect.
For example, Gartner states that Linux shipments in the supercomputer field
were zero.
In fact, Linux is widely used on commodity parallel clusters
at many scientific sites, including many high-profile sites.
Many of these systems were assembled in-house, showing that
Gartner’s method of defining a “shipment” does not appear to
correlate to working installations.
The Register’s article,
“No one’s
using Linux”
(with its companion article
“90% Windows..”)
discusses this further.
In short, Microsoft-sponsored research has reported low numbers, but
these numbers are quite suspect.
-
Businesses plan to increase their use of GNU/Linux.
A Zona Research study
found that over half of the large enterprise respondents expected
increases of up to 25% in the number of GNU/Linux users in their firm, while
nearly 20% expected increases of over 50%.
In small companies, over one third felt that GNU/Linux usage would
expand by 50%.
The most important factors identified that drove these
decisions were reliability, lower price,
speed of applications, and scalability.
Here are the numbers:
| Expected GNU/Linux Use | Small Business | Midsize Business | Large Business | Total |
|---|
| 50% increase | 21.0% | 16% | 19.0% | 19% |
|---|
| 10-25% increase | 30.5% | 42% | 56.5% | 44% |
|---|
| No growth | 45.5% | 42% | 24.5% | 36% |
|---|
| Reduction | 3.0% | 0% | 0% | 1% |
|---|
You can see more about this study in
“The New Religion: Linux and Open Source” (ZDNet)
and in InfoWorld’s February 5, 2001 article
“Linux lights up enterprise: But concerns loom about OS vendor profitability.”
-
The global top 1000 Internet Service Providers expect GNU/Linux use
to increase by 154%, according to Idaya’s survey conducted
January through March 2001.
A
survey
conducted by Idaya
of the global top 1000 ISPs
found that they expected GNU/Linux to grow a further 154% in 2001.
Also, almost two thirds (64%) of ISPs consider the leading open source
software meets the standard required for enterprise level applications,
comparable with proprietary software.
Idaya produces OSS/FS software, so keep that in mind as a potential bias.
-
A 2002 European survey found that 49% of CIOs in financial services,
retail, and the public sector expect to be using OSS/FS.
OpenForum Europe published in February 2002 a survey titled
Market Opportunity Analysis For Open Source Software.
Over three months CIOs and financial directors
in financial services, retail and public sector were interviewed for this
survey.
In this survey,
37% of the CIOs stated that they were already using OSS/FS,
and 49% expected to be using OSS/FS in the future.
It is quite likely that even more companies are using OSS/FS but
their CIOs are not aware of it.
Perceived benefits cited included decreased costs in general (54%),
lower software license cost (24%), better control over development (22%),
and improved security (22%).
-
IBM found a 30% growth in the number of enterprise-level applications
for GNU/Linux in the six month period ending June 2001.
At one time, it was common to claim that
“Not enough applications run under GNU/Linux”
for enterprise-level use.
However,
IBM found there are over 2,300
GNU/Linux applications (an increase in 30% over 6 months)
available from IBM and the industry’s top
independent software vendors (ISVs).
A
Special report by Network Computing on Linux for the Enterprise
discusses some of the strengths and weaknesses of GNU/Linux, and
found many positive things to say about GNU/Linux for enterprise-class
applications.
-
Morgan Stanley found significant and growing use of GNU/Linux.
They surveyed 225 CIOs on August 2002,
and among the respondents, 29% said they owned GNU/Linux servers,
8% did not but are formally considering buying them, and
17% of the CIOs said they neither owned nor were formally considering
GNU/Linux servers but that they were informally considering them.
The remainder (slightly less than half, or 46%)
noted they didn’t own and weren’t considering GNU/Linux.
For those that have recently purchased new GNU/Linux servers,
31% were adding capacity, 31% were replacing Windows systems,
24% were replacing Unix and 14% were replacing other OSes.
It’s easier to transition to GNU/Linux from Unix than from Windows,
so it’s intriguing that Windows was being replaced more often than Unix.
CNet news commented
on this study with additional commentary about open source vs. Microsoft.
-
Revenue from sales of GNU/Linux-based server systems
increased 90% in the fourth quarter of 2002 compared to the fourth
quarter of 2001.
This 90% increase compared sharply with the 5% increase of
server market revenue overall.
This data was determined by Gartner Dataquest, and
reported in C|Net.
Sales of GNU/Linux servers increased 63% from 2001 to 2002.
This is an increase from $1.3 billion to $2 billion,
according to Gartner.
-
In a survey of business users by Forrester Research Inc.,
52% said they are now replacing Windows servers with Linux.
Business Week quoted this survey in a January 2005 article,
noting that GNU/Linux
is forcing Microsoft to offer discounts to avoid losing even more sales.
-
A 2001 survey found that 46.6% of IT professionals were confident
that their organizations could support GNU/Linux, a figure larger
than any OS except Windows.
A
TechRepublic Research survey titled
Benchmarks, Trends, and Forecasts: Linux Report
found that “support for Linux runs surprisingly deep”
when it surveyed IT professionals and asked them how confidently their
organizations could support various OSes.
Given Windows’ market dominance on the desktop, it’s not surprising
that most were confident that their organizations could support various
versions of Windows
(for Windows NT the figure was 90.6%; for Windows 2000, 81.6%).
However, GNU/Linux came in third, at 46.4%; about half of
those surveyed responded that their organizations were
already confident in their ability to support GNU/Linux!
This is especially shocking because GNU/Linux beat other well-known
products with longer histories including Unix (42.1%),
Novell Netware (39.5%), Sun Solaris (25.7%), and Apple (13.6%).
TechRepublic suggested that there are several possible reasons for this
surprisingly large result:
- GNU/Linux is considered to be a rising technology;
many IT professionals are already studying it
and learning how to use it, assuming that it will be
a marketable skill in the near future.
- Many IT professionals already use GNU/Linux at home,
giving GNU/Linux an entree into professional organizations.
- Since GNU/Linux is similar to Unix,
IT professionals who are proficient in Unix can easily pick up GNU/Linux.
TechRepublic suggests that IT executives should inventory their staff’s
skill sets, because they may discover that their organization can already
support GNU/Linux if they aren’t currently using it.
-
Sendmail, an OSS/FS program, is the leading email server.
A survey
between 2001-09-27 and 2001-10-03
by D.J. Bernstein of one million random IP addresses
successfully connected to 958 SMTP (email) servers
(such servers are also called mail transport agents, or MTAs).
Bernstein found
that Unix Sendmail had the largest market share (42% of
all email servers), followed by
Windows Microsoft Exchange (18%),
Unix qmail (17%), Windows Ipswitch IMail (6%),
Unix smap (2%), UNIX Postfix (formerly VMailer, 2%)
and Unix Exim (1%).
Note that Bernstein implements one of Sendmail’s competitors (qmail),
so he has a disincentive to identify Sendmail’s large market share.
Qmail is not OSS/FS, because
modified derivatives of Qmail cannot be freely redistributed
(without express permission by the author).
Qmail is “source viewable,”
so some people are confused into believing that Qmail is OSS/FS.
However, Sendmail, Postfix, and Exim are all OSS/FS.
Indeed, not only is the leading program (Sendmail) OSS/FS, but that OSS/FS
program has more than twice the installations of its nearest competition.
-
A survey in the second quarter of 2000 found that 95% of all
reverse-lookup domain name servers (DNS) used bind, an OSS/FS product.
The Internet is built from many mostly-invisible infrastructure components.
This includes domain name servers (DNSs), which take human-readable machine
names (like “yahoo.com”) and translate them into numeric addresses.
Publicly accessible machines also generally support “reverse lookups”, which
convert the numbers back to names; for historical reasons, this is implemented
using the hidden “in-addr.arpa” domain.
By surveying the in-addr domain, you can gain insight into
how the whole Internet is supported.
Bill Manning
has surveyed the in-addr domain and found that
95% of all name servers (in 2q2000)
performing this important Internet infrastructure task are
some version of “bind.”
This includes all of the
DNS root servers,
which are critical for keeping the Internet functioning.
Bind is an OSS/FS program.
-
A survey in May 2004 found that over 75% of all DNS domains
are serviced by an OSS/FS program.
Don Moore’s DNS Server Survey completed May 23, 2004
surved DNS servers.
He found that BIND (an OSS/FS program) serviced 70.105% of all domains,
followed by TinyDNS (15.571%), Microsoft DNS Server (6.237%),
MyDNS (2.792%), PowerDNS (1.964%), SimpleDNS Plus (1.25%), unknown
(1.138%), and the Pliant DNS Server (0.277%),
with many others trailing.
Since BIND, MyDNS, PowerDNS, and Pliant are all OSS/FS, OSS/FS programs
service 75.138% of all DNS domains.
The figures are different if you count per-installation instead of
per-domain, but OSS/FS still dominates.
Counting per-platform, we have BIND (72.598%), Microsoft (21.711%),
TinyDNS (2.587%), unknown (1.041%), Simple DNS Plus (0.922%),
MyDNS (0.314%), PowerDNS (0.26%).
Totalling BIND, MyDNS, and PowerDNS produces the trivially smaller
figure of 73.172% supported by DNS.
This difference in figures shows that about 3 out of 4
organizations choose the OSS/FS BIND when installing a DNS server,
and the 1 in 4 who don’t and then choose Microsoft tend to be those supporting
fewer domains (otherwise the Microsoft count of domains would be larger).
In any case, given the critical nature of DNS to the Internet,
it’s clear that OSS/FS is a critical part of it.
-
PHP is the web’s #1 Server-side Scripting Language.
PHP, a recursive acronym for “PHP: Hypertext Preprocessor”, is an
open source server-side scripting language designed for creating
dynamic Web pages (e.g., such as e-commerce).
As noted in a June 3, 2002 article,
PHP recently surpassed Microsoft’s ASP to become the most
popular server-side Web scripting technology on the Internet, and was
used by over 24% of the sites on the Internet.
Of the 37.6 million web sites surveyed worldwide, PHP is running on
over 9 million sites, and over
the past two years PHP has averaged a 6.5% monthly growth rate.
-
OpenSSH is the Internet’s #1 implementation of the SSH
security protocol.
The Secure Shell (SSH) protocol is widely used to
securely connect to computers and control them remotely
(using either a text or X-Windows graphical interface).
On April 2002, a survey of 2.4 million Internet addresses found that
OpenSSH, an OSS/FS implementation of SSH,
was the #1 implementation, with 66.8% of the market;
the proprietary “SSH” had 28.1%, Cisco had 0.4%, and others totaled 4.7%.
You can see
general information
about the survey, or the
specific
SSH statistics for April 2002.
It’s also interesting to note that OpenSSH had less than 5% of the
market in the third quarter of 2000, but its use steadily grew.
By the fourth quarter of 2001, over half of all users of the SSH protocol
were using OpenSSH, and its market share has continued to grow since.
-
CMP TSG/Insight found that 41% of application development tools
were OSS/FS, and VARBusiness found 20% of all companies using GNU/Linux.
VARBusiness reported in September 2003 on “The Rise of Linux”.
In the article,
it reports a finding of CMP TSG/Insight:
41% of application development tools in use were OSS/FS,
second only to Microsoft (76%) and leading Oracle (35%),
IBM (26%), Sun (21%), and Borland (18%).
They also reported their own finding that
20% of all companies they surveyed were GNU/Linux,
presumably less than that of Microsoft, but twice that of
Netware and Unix.
Indeed, they note that GNU/Linux has transformed
“from a curiosity to a core competency.”
-
A set of 2003 Gartner studies notes
that the TCO of Linux (or OSS/FS) on the Desktop depends on your situation.
Gartner
reported that that enterprises that installed Linux on client desktops
would save $80 in hardware acquisition costs and an average of $74
per user per year on office automation software
(assuming that StarOffice will be purchased instead of Microsoft Office).
However, they also note that
“lost productivity stemming from learning curves and compatibility can
eat up direct-cost savings when moving to Linux on the desktop.”
A key issue is that many organizations have built or bought specialized
applications that only run on Windows.
Note that these studies primarily examine Linux vs. Windows on the
client desktop, not other OSS/FS deployment options
(such as moving to web-based applications using OSS/FS tools
that work with any client operating system,
or using OSS/FS applications on Windows).
Gartner concludes that both Windows and GNU/Linux can have a lower TCO,
depending on your circumstance, and that
“before migrating your desktop computers to Linux,
take inventory of your business applications and compare Linux to Windows
in terms of total cost of ownership.”
-
MySQL’s market share is growing faster than Windows’.
An Evans Data survey released in January 2004
found that the use of
OSS/FS database MySQL grew 30% over the year, vs. 6% for
Microsoft’s SQL Server and Access databases,
according to a survey of 550 developers.
Microsoft still has a far greater total market share
in the database development market, but
Evans Data reported that
OSS/FS’s “price and its ability to integrate with other software
mesh well with the priorities of application developers” and that
“Concerns over stability, expense and how well a database plays with
others are leading a quickly growing number of...companies to seriously
consider and implement an open source database solution.”
Evans Data noted that “We expect this trend to continue as the open
source offerings are continually improved upon.”
-
Internet
Explorer has been losing marketshare to OSS/FS web browsers (such as
Mozilla Firefox) since mid-2004, a trend especially obvious in leading
indicators such as technology sites, web development sites, and bloggers.
PC World found that in
July 2004, Internet Explorer began to measurably lost market share
to OSS/FS browsers.
According to PC World,
IE lost 1% of its market share in a single month, July 2004.
In the same time period Mozilla-based browser use increased by 26%
(when compared to its previous share).
IE was still far more widely used at this time
according to this July 2004 poll (94.73%),
but IE hadn’t lost market share
for many years, and it takes a significant event for that many people
to change browsers.
This was probably at least in part due to
repeated security problems
(though its poor support of web standards and lack of features may also
have had a role).
Note that the major Mozilla rewrite of its web browser,
Mozilla Firefox,
wasn’t even officially available at time; Firefox wasn’t
officially released until November 9, 2004.
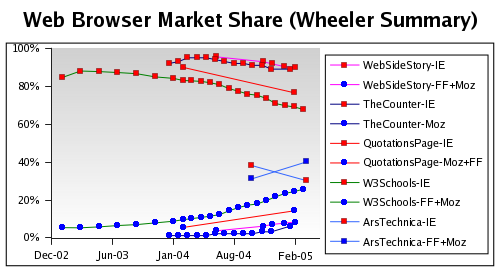
A multitude of studies show that IE is losing market share,
while OSS/FS web browsers (particularly Firefox) are gaining market share.
The figure above shows web browser market share over time;
the red squares are Internet Explorer’s market share (all versions),
and the blue circles are the combination of the older Mozilla suite and
the newer Mozilla Firefox web browser (both of which are OSS/FS).
OSS/FS web browsers (particularly Firefox) are gradually
gaining market share among the general population of web users.
By November 1, 2004, Ziff Davis revealed that IE had lost about another
percent of the market in only 7 weeks.
Chuck Upsdell has combined many data sources and estimates that,
as of September 2004, IE has decreased from 94% to 84%,
as users switch to other browser families (mainly Gecko); he also believes
this downward trend is likely to continue.
Information Week reported in March 18, 2005,
some results from Net Applications (a maker of Web-monitoring software).
Net Applications found that
Firefox use rose to 6.17% of the market in February 2005,
compared to 5.59% in January 2005.
WebSideStory reported in February 2005 that
Firefox’s general market share was 5.69% as of February 18, 2005, compared
to IE’s 89.85%.
OneStat reported on February 28, 2005, that
Mozilla-based browsers’ global usage share
(or at least Firefox’s) is 8.45%, compared to IE’s 87.28%.
Co-founder Niels Brinkman suspects that
IE 5 users were upgrading to Firefox, not IE 6, as
at least one reason why
“global usage share of Mozilla’s Firefox is still increasing and
the total global usage share of Microsoft’s Internet Explorer
is still decreasing.”
The site
TheCounter.com reports global statistics about web browsers;
February
2005 shows Mozilla-based browsers (including Firefox, but not
Netscape) had 6%, while IE 6 had 81% and IE 5 had 8% (89% total for IE).
This is a significant growth; the
August 2004 study of 6 months earlier had
Mozilla 2%, IE 6 with 79%, and IE 5 with 13% (92% for IE).
The website
quotationspage.com is
a popular general-use website;
quotationspage statistics of February 2004 and 2005
show a marked rise in the use of OSS/FS browsers.
In February 2004, IE had 89.93% while Mozilla-based browsers accounted for
5.29% of browser users; by February 2005, IE had dropped to 76.47% while
Mozilla-based browsers (including Firefox) had risen to 14.11%.
Janco Associates also
reported Firefox market share data;
comparing January 2005 to April 2005, Firefox had jumped from
4.23% to 10.28% of the market
(IE dropped from 84.85% to 83.07% in that time, and
Mozilla, Netscape, and AOL all lost market share in this time as well
according to this survey).
Nielsen/NetRatings’ survey of site visitors found that
in June 2004, 795,000 people visited the Firefox website (this was the
minimum for their tracking system).
There were 2.2 million in January 2005, 1.6 million in February, and
2.6 million people who visited the Firefox web site in March 2005.
The numbers were also up for Mozilla.org, the Web site of
the Mozilla Foundation (FireFox’s developer).
The growth of OSS/FS web browsers
becomes even more impressive when home users are specifically studied.
Home users can choose which browser to use, while many
businesses users cannot choose their web browser (it’s selected by
the company, and companies are often slow to change).
XitiMonitor surveyed a sample of websites used on a Sunday
(March 6, 2005), totalling 16,650,993 visits.
By surveying Sunday, they intended to primarily find out what people
choose to use.
Of the German users, an astonishing 21.4% were using Firefox.
The other countries surveyed were France (12.2%), England (10.9%),
Spain (9%), and Italy (8.6%).
Here is
the original XitiMonitor study of 2005-03-06,
an
automated translation of the XitiMonitor study,
and
a blog summary of the XitiMonitor study
observing that,
“Web sites aiming at the consumer have [no] other choice but [to make]
sure that they are compatible with Firefox ...
Ignoring compatibility with Firefox and other modern browsers
does not make sense business-wise.”
Using this data, we can determine that
13.3% of European home users were using Firefox
on this date in March 2005.
How do can get such a figure?
Well, we can use these major European countries as representatives of
Europe as a whole; they’re certainly representative of western
Europe, since they’re the most populous countries.
Presuming that the vast majority of Sunday users are home users is
quite reasonable for Europe.
We can then make the reasonable presumption that the number of
web browser users is proportional to the general
population.
Then we just need to get the countries’ populations; I used the
CIA World Fact Book
updated to 2005-02-10.
These countries’ populations (in millions) are, in the same order as above,
82, 60, 60, 40, and 58;
calculating
(21.4%*82 + 12.2%*60 + 10.9%*60 + 9%*40 + 8.6%*58) / (82+60+60+40+58)
yields 13.3%.
Among leading-edge indicators such as
the technically savvy and web developers, the market penetration
has been even more rapid and widespread.
In one case (Ars Technica), Firefox has become the leading
web browser!
This is a leading indicator because these are the people
developing the web sites you’ll see tomorrow;
in many cases, they’ve already switched to OSS/FS web browsers such as Firefox.
W3schools is a site dedicated to aiding web developers, and
as part of their role track the browsers that web developers use.
W3schools
found a dramatic shift
from July 2003 to September 2004,
with IE dropping from 87.2% to 74.8% while Gecko-based browsers
(including Netscape 7, Mozilla, and Firefox) rising from 7.2% to 19%.
(
W3Schools’ current statistics are available).
This trend has continued;
as of March 2005 Firefox was still growing in market share,
having grown to 21.5% (with an increase every month),
while IE was shrinking quickly (IE 6 was down to 64.0% and decreasing
every month).
CNN found that among its CNET News.com readers,
site visitors with OSS/FS browsers jumped up from 8% in January 2004 to
18% by September 2004.
Statistics for
Engadget.com, which has a technical audience,
found that as of September 2004,
only 57% used a MS browser and Firefox had rapidly risen to 18%.
IT pundits such as
PC Magazine’s John C. Dvorak reported even more dramatic slides, with
IE dropping to 50% share.
InformationWeek
reported that on March 30, 2005, 22% of visitors used Firefox,
versus 69% who used Internet Explorer.
The technical website
Ars Technica reported on March 27, 2005, that
Firefox was now their #1 browser at 40%,
while IE was down to #2 at 30% (vs. 38% in September 2004).
Bloggers, another group of especially active web users (and thus, I
believe, another leading indicator) also suggest this is a trend.
InformationWeek’s March 30, 2005 article
“Firefox Thrives Among Bloggers”
specifically discussed this point.
InformationWeek reported that on
Boing Boing, one of the most popular blog sites, March 2005 statistics
show that more of their users use Firefox than Internet Explorer:
35.9% of its visitors use Firefox, compared with 34.5%
using Internet Explorer.
I checked Boing Boing’s April 2, 2004 statistics; they
reported Firefox at 39.1%,
IE at 33.8%, Safari at 8.8%, and Mozilla at 4.1%; this means that
Firefox plus Mozilla was at 43.2%, significantly beyond IE’s 33.8%.
Between January 1 though March 9, the Technometria blog
found that “Firefox accounted for 28% of browsers compared
with 58% for Internet Explorer.”
Kottke.org reported on February 27 that 41% of visitors
used Mozilla-based browsers (such as Firefox),
while 31% used Internet Explorer.
These increasing market share statistics are occurring
in spite of problems with the data that work against OSS/FS browsers.
Some non-IE browsers are configured to
lie and use the same identification string as
Internet Explorer, even though they aren’t actually IE.
Thus, all of these studies are actually
understating the actual share of non-IE browsers,
though the amount of understatement is generally unknown.
In short, efforts such as the grassroots
Spread Firefox marketing group
seem to have been very effective at convincing people to
try out the OSS/FS web browser Firefox.
Once people try it, they appear to like it enough to continue using it.
-
As of 2004, a CSC study determined that
an astonishing 14% of the large enterprise office systems
market are using OSS/FS OpenOffice.org.
Consulting firm Computer Sciences Corp. (CSC)
unsurprisingly found that
Microsoft dominates the office suite market,
with 95% of the overall share and more than 300 million users worldwide.
But surprisingly,
they found that
the OSS/FS OpenOffice.org has secured 14% of the
large enterprise office systems market,
with over 16 million downloads and countless CD installations.
-
A February 2005 survey of developers and database administrators found that
64% use an Open Source database.
Evans Data Corp.’s “Winter 2005 Database Development Survey”
of developers and database administrators (DBAs), released February 2005,
found a strong increase in use
of a variety of OSS/FS databases throughout corporate U.S.
Evans found 64% (about two-thirds) use Open Source databases (up from 58%
the previous year),
and over 50% use (or plan to use) XQuery and other open
web services standards with their data -- Open Source or proprietary.
Two key factors seem to driving this rise:
survey respondents indicated that OSS/FS databases are
increasing their performance and scalability to the point
where they are acceptable for use in corporate enterprise environments, and
many organizations have tight IT and database development budgets.
Evans found that MySQL, PostgreSQL, and Firebird were popular OSS/FS
databases.
Evans found FireBird is the most used database among all
database programs for ‘edge’ applications, with
Microsoft Access as a close second (at 21%).
In addition, MySQL and FireBird are locked in a virtual tie in
the OSS/FS database space; each are used by just over
half of database developers who use OSS/FS databases.
Perhaps the simplest argument that GNU/Linux will have a significant
market share is that
Sun is modifying its Solaris product to run GNU/Linux applications,
and IBM has already announced that GNU/Linux will be the successor of
IBM’s own AIX.
There are a lot of anecdotal stories that OSS/FS is more reliable,
but finally there is quantitative data confirming that mature OSS/FS
programs are often more reliable:
-
Equivalent OSS/FS applications are more reliable, according to
the Fuzz study.
The paper
“Fuzz Revisited”
paper measured reliability by feeding programs random characters and
determining which ones resisted crashing and freeze-ups.
This approach is unlikely to find subtle failures, yet
the study authors found that their approach
still manages to find many errors in production software and is a
useful tool for finding software flaws.
What’s more, this approach is extremely fair and can be broadly
applied to any program, making it possible to compare different programs fairly.
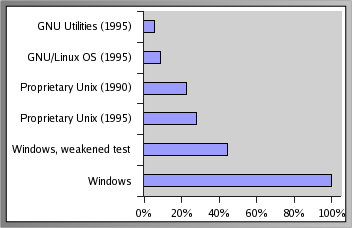
Failure Rates as Measured by Fuzz Tests

OSS/FS had higher reliability by this measure.
It states in section 2.3.1 that:
It is also interesting to compare results of testing the
commercial systems to the results from testing “freeware” GNU and Linux.
The seven commercial systems in the 1995 study have an
average failure rate of 23%,
while Linux has a failure rate of 9% and the GNU utilities have a failure
rate of only 6%.
It is reasonable to ask why a globally scattered group of programmers, with
no formal testing support or software engineering standards can
produce code that is more reliable
(at least, by our measure) than commercially produced code.
Even if you consider only the utilities
that were available from GNU or Linux,
the failure rates for these two systems are better than the other systems.
There is evidence that Windows applications have even less reliability than
the proprietary Unix software
(e.g., less reliable than the OSS/FS software).
A later paper published in 2000,
“An Empirical
Study of the Robustness of Windows NT Applications Using Random Testing”,
found that with Windows NT GUI applications, they could crash 21% of the
applications they tested, hang an additional 24% of the applications,
and could crash or hang all the tested applications when subjecting
them to random Win32 messages.
Indeed, to get less than 100% of the Windows applications to crash, they
had to change the conditions of the test so that certain test patterns
were not sent.
Thus, there’s no evidence that proprietary Windows software
is more reliable than OSS/FS by this measure.
Yes, Windows has progressed since that time - but so have the OSS/FS programs.
Although the OSS/FS experiment was done in 1995, and the Windows
tests were done in 2000, nothing that’s happened since
suggests that proprietary software has become much better than
OSS/FS programs since then.
Indeed, since 1995 there’s been an increased interest and
participation in OSS/FS, resulting
in far more “eyeballs” examining and improving the
reliability of OSS/FS programs.
The fuzz paper’s authors also found that proprietary software vendors
generally didn’t fix the problems identified in an
earlier version of their paper (from 1990), and they found that concerning.
There was a slight decrease in failure rates between their 1990 and 1995
paper, but many of the flaws they found (and reported) in the
proprietary Unix programs were still not fixed 5 years later.
In contrast,
Scott Maxwell led an effort to remove every flaw identified in the OSS/FS
software
in the 1995 fuzz paper, and eventually fixed every flaw.
Thus, the OSS/FS community’s response shows why,
at least in part, OSS/FS programs have such an edge in reliability;
if problems are found, they’re often fixed.
Even more intriguingly, the person who spearheaded ensuring that
these problems were fixed
wasn’t an original developer of the programs - a situation
only possible with OSS/FS.
Now be careful: OSS/FS is not magic pixie dust; beta software of
any kind is still buggy!
However, the 1995 experiment measured mature OSS/FS to mature proprietary
software, and the OSS/FS software was more reliable under this measure.
-
IBM studies found GNU/Linux highly reliable.
IBM ran a series of extremely stressful tests for 30 and 60 days, and
found that the Linux kernel and other core OS components -- including libraries,
device drivers, file systems, networking, IPC, and memory management --
operated consistently and completed all the expected durations of runs
with zero critical system failures.
Linux system performance was not degraded during the long duration of the run,
the Linux kernel properly scaled to use hardware resources
(CPU, memory, disk) on SMP systems,
the Linux system handled continuous full CPU load (over 99%)
and high memory stress well, and
the Linux system handled overloaded circumstances correctly.
IBM declared that these
tests demonstrate that “the Linux kernel and other core OS components
are reliable and stable ... and can provide a
robust, enterprise-level environment for customers over long periods of time.”
-
GNU/Linux is more reliable than Windows NT, according to a 10-month
ZDnet experiment.
ZDnet
ran a 10-month test for reliability to compare
Caldera Systems OpenLinux, Red Hat Linux, and
Microsoft’s Windows NT Server 4.0 with Service Pack 3.
All three used identical (single-CPU) hardware, and
network requests were sent to each server in parallel
for standard Internet, file, and print services.
The result:
NT crashed an average of once every six weeks, each taking about 30
minutes to fix; that’s not bad, but
neither GNU/Linux server ever went down.
This ZDnet article also does a good job of identifying GNU/Linux weaknesses
(e.g., desktop applications and massive SMP).
Hopefully Windows has made improvements since this study - but
the OSS/FS have certainly made improvements as well.
-
GNU/Linux is more reliable than Windows NT, according to a one-year
Bloor Research experiment.
Bloor Research
had both OSes running on relatively old Pentium machines.
During the one year test, GNU/Linux crashed once
due to a hardware fault (disk problems), which took 4 hours to
fix, giving it a measured availability of 99.95 percent. Windows NT
crashed 68 times, caused by hardware problems (disk), memory (26
times), file management (8 times), and various odd problems (33 times).
All this took 65 hours to fix, giving an availability of 99.26 percent.
It’s intriguing that the only GNU/Linux problem and many of the Windows
problems were hardware-related;
it could be argued that the Windows hardware was worse, or it could
be argued that GNU/Linux did a better job of avoiding and
containing hardware failures.
The file management failure is due to Windows,
and the odd problems appear due to Windows too,
indicating that GNU/Linux is far more reliable than Windows.
GNet summarized this as saying “the winner here is clearly Linux.”
-
A study by Reasoning found that the Linux kernel’s implementation
of the TCP/IP Internet protocol stack had fewer defects than
the equivalent stacks of several proprietary general-purpose operating
systems, and equalled the best of the embedded operating systems.
As noted in
their press release and
C|Net,
Reasoning’s study compared six implementations of TCP/IP,
the fundamental protocols underlying the Internet.
Besides the Linux kernel, three of the implementations were
part of commercial general-purpose operating systems, and
two were embedded in commercial telecommunications equipment.
The Linux kernel primarily used as the kernel of a
general-purpose operating system; it would
be reasonable to expect that the embedded operating systems would have
better reliability because of the need for reliability in that market.
The study was not commissioned by any of the GNU/Linux vendors or
companies who might be competing with GNU/Linux, and thus should be
free of bias.
The company used automated tools to
look five kinds of defects in code: Memory leaks,
null pointer dereferences, bad deallocations,
out of bounds array access and uninitialized variables.
Reasoning found 8 defects in 81,852 lines of Linux kernel source lines
of code (SLOC), resulting in a defect density rate of 0.1 defects per KSLOC.
In contrast, the three proprietary general-purpose operating systems
(two of them versions of Unix) had between 0.6 and 0.7 defects/KSLOC;
thus the Linux kernel had a smaller defect rate than all the competing
general-purpose operating systems examined.
The rates of the two embedded operating systems were 0.1 and 0.3 defects/KSLOC,
thus, the Linux kernel had an defect rate better than one embedded
operating system, and equivalent to another.
One issue is that the tool detects issues that may not be true problems.
For example, of those 8 defects,
one was clearly a bug and had been separately detected and
fixed by the developers,
and 4 defects clearly had no effect on the running code.
None of the defects found were security flaws.
To counter this, they also tracked which problems were repaired by the
developers of the various products.
The Linux kernel did quite well by this measure as well:
the Linux kernel had 1 repaired defect out of 81.9 KSLOC,
while the proprietary implementations had 235 repaired defects out of
568 KSLOC. This means the Linux kernel had a repair defect rate of 0.013
defects/KSLOC, while the proprietary implementations had a repair defect rate
of 0.41 defects/KSLOC.
CEO Scott Trappe explained this result by
noting that the open source model encourages several behaviors
that are uncommon in the development of commercial code.
First, many users don’t just report bugs, as they would do
with [proprietary] software, but actually track them down to their
root causes and fix them.
Second, many developers are reviewing each other’s code, if only
because it is important to understand code before it can be
changed or extended.
It has long been known that peer review is the most effective way
to find defects.
Third, the open source model seems to encourage a meritocracy,
in which programmers organize themselves around a project based
on their contributions.
The most effective programmers write the most crucial code,
review the contributions of others, and decide which of these
contributions make it into the next release.
Fourth, open source projects don’t face the same type of
resource and time pressures that [proprietary] projects do.
Open source projects are rarely developed against a fixed timeline,
affording more opportunity for peer review and extensive beta testing
before release.
This certainly doesn’t prove that OSS/FS will always be the highest
quality, but it clearly shows that OSS/FS can be of high quality.
-
A similar study by Reasoning found that the MySQL database
(a leading OSS/FS database) had
fewer defects than a set of 200 proprietary programs used for
comparison.
In a similar manner to the previous study, on December 15, 2003,
Reasoning announced its analysis results comparing
MySQL with various proprietary programs.
MySQL had found 21 software defects in 236,000 source lines of code (SLOC),
producing a defect density of 0.09 defects/KSLOC.
Using a set of 200 recent proprietary projects (totalling 35 million SLOC),
the same tools found a defect rate of 0.57 defects/KSLOC -- over six times
the error rate.
Again, not all defects are found by their tool, and
this certainly doesn’t prove that OSS/FS will always be the highest
quality, but it clearly shows that OSS/FS can be of high quality.
-
A study by Coverity found that the Linux kernel had far fewer
defects than the industry average.
Code-analysis firm Coverity performed a
four-year research effort and found that
the Linux kernel has significantly fewer software bugs in it than the
industry average.
Coverity’s approach reported 985 defects in the 5.7 million
lines of code in the that make up the Linux kernel.
According to data from Carnegie Mellon University, a
typical program of similar size would usually have
more than 5,000 defects.
Coverity CEO Seth Hallem summarized this by saying,
“Linux is a very good system in terms of bug density.”
It’s not known how this compares to Microsoft Windows;
Coverity did not have access to source code for the Microsoft Windows kernel.
Coverity also did not have the source code
for the many third-party drivers for Windows;
these would need to be included for an accurate comparison, especially
since Windows driver problems are known to be a significant problem
in the reliability of many Windows deployments.
-
Sites using Microsoft’s IIS web serving software have over double
the time offline (on average) than sites using the Apache software,
according to a 3-month Swiss evaluation.
These are the results of
Syscontrol AG’s
analysis of website uptime (announced February 7, 2000)
They measured over 100 popular Swiss web sites over a three-month period,
checking from 4 different locations every 5 minutes
(it’d be interesting to see what a larger sample would find!).
You can
see their report
(in German), or a
Babelfish
(machine) translation of the report.
Here’s their set of published
data on “average down-time (in hours in that month) for each
type of server”,
plus a 3-month average that I’ve computed:
| Downtime |
Apache |
Microsoft |
Netscape |
Other |
| September |
5.21 |
10.41 |
3.85 |
8.72 |
| October |
2.66 |
8.39 |
2.80 |
12.05 |
| November |
1.83 |
14.28 |
3.39 |
6.85 |
| Average |
3.23 |
11.03 |
3.35 |
9.21 |
It’s hard not to notice that Apache (the OSS web server)
had the best results over the three-month average (and with better results
over time, too).
Indeed, Apache’s worst month was better than Microsoft’s best month.
The difference between Netscape and Apache is statistically
insignificant - but this still shows that the freely-available
OSS/FS solution (Apache)
has a reliability at least as good as the most reliable proprietary solution.
The report does state that this might not be solely the fault of the software’s
quality, and in particular it noted that several Microsoft IIS sites
had short
interruptions at the same time each day (suggesting regular restarts).
However, this still begs the question - why did the IIS sites require
so many regular restarts compared to the Apache sites?
Every outage, even if preplanned, results in a service loss
(and for e-commerce sites, a potential loss of sales).
Presumably, IIS site owners who perform periodic restarts do so because they
believe that doing so will improve their IIS systems’ overall reliability.
Thus, even with pre-emptive efforts to keep the IIS systems reliable,
the IIS systems are less reliable than the Apache-based systems which simply
do not appear to require constant restarting.
-
80% of the top ten most reliable hosting providers
ran OSS/FS, according to Netcraft’s May 2004 survey
Netcraft’s May 2004 survey of the top ten most reliable
hosting providers
found 4 running GNU/Linux, 4 running FreeBSD, and only 2 running Microsoft
Windows.
-
OSS/FS did very well in a separate uptime study by Netcraft;
as of August 3, 2001, of the 50 sites with the highest uptimes,
92% use Apache and 50% run on OSS/FS OSes.
Netcraft keeps a track of the 50 often-requested
sites with the longest uptimes at
http://uptime.netcraft.com.
Looking at
the August 3, 2001 uptime report,
I found that 92% (46/50) of the sites use Apache;
one site’s web server was unknown, and three others were not Apache.
Of those three, only one reported to be Microsoft IIS,
and that one instance is suspicious because
its reported OS is BSD/OS
(this apparent inconsistency can be explained in many ways, e.g.,
perhaps there is a front-end BSD/OS system that “masks” the IIS web site,
or perhaps the web server is lying about its type to confuse attackers).
In this snapshot, 50% (25/50) ran on an OSS/FS OS,
and only Unix-like OSes had these large uptimes
(no Windows systems were reported as having the best uptimes).
As with all surveys, this one has weaknesses, as discussed in
Netcraft’s Uptime FAQ.
Their techniques for identifying web server and OSes can be fooled.
Only systems for which Netcraft was sent many requests were included
in the survey (so it’s not “every site in the world”).
Any site that is requested through the “what’s that site running”
query form at Netcraft.com is added to the set of sites
that are routinely sampled; Netcraft doesn’t routinely monitor all
22 million sites it knows of for performance reasons.
Many OSes don’t provide uptime information and thus
can’t be included; this includes
AIX, AS/400, Compaq Tru64, DG/UX, MacOS, NetWare, NT3/Windows 95,
NT4/Windows 98, OS/2, OS/390, SCO UNIX, Sony NEWS-OS, SunOS 4, and VM.
Thus, this uptime counter can only include systems running on
BSD/OS, FreeBSD (but not the default configuration in versions 3 and later),
recent versions of HP-UX, IRIX,
GNU/Linux 2.1 kernel and later (except on Alpha processor based systems),
MacOS X, recent versions of NetBSD/OpenBSD, Solaris 2.6 and later, and
Windows 2000.
Note that Windows NT systems cannot be included
in this survey (because their uptimes couldn’t be counted).
Windows 2000 systems’s data are included in the source source for this survey,
but they have a different problem.
Windows 2000 had little hope to be included in the August 2001
list, because the 50th system in the list had an uptime of 661 days,
and Windows 2000 had only been launched about 17 months (about 510 days)
earlier.
Note that HP-UX, GNU/Linux (usually), Solaris
and recent releases of FreeBSD cycle back to zero after 497 days,
exactly as if the machine had been rebooted at that precise point.
Thus it is not possible to see an HP-UX, GNU/Linux (usually),
or Solaris system
with an uptime measurement above 497 days, and in fact their uptimes
can be misleading (they may be up for a long time, yet not show it).
There is yet one other weakness: if a computer switches operating
systems later, the long uptime is credited to the new OS.
Still, this survey does compare Windows 2000, GNU/Linux
(up to 497 days usually),
FreeBSD, and several other OSes,
and OSS/FS does quite well.
It could be argued that perhaps systems on the Internet
that haven’t been rebooted for such a long time might be insignificant,
half-forgotten, systems.
For example, it’s possible that security patches aren’t being
regularly applied, so such long uptimes are not necessarily good things.
However, a counter-argument is that Unix and Linux systems don’t need to
be rebooted as often for a security update, and this is a valuable
attribute for a system to have.
Even if you accepted that unproven
claim, it’s certainly true that there are half-forgotten Windows systems, too,
and they didn’t do so well.
Also, only systems someone specifically asked for information about were
included in the uptime survey, which would limit the number of
insignificant or half-forgotten systems.
At the very least, Unix and Linux are able to quantitatively demonstrate
longer uptimes than their Windows competitors can, so Unix and Linux have
significantly better evidence of their reliability than Windows.
- An in-depth analysis (published in the Communications
of the ACM) found good evidence that OSS/FS code quality appears to be
at least equal and sometimes better than proprietary software.
The article
“Open Source Software Development Should Strive for Even Greater
Code Maintainability” by
Ioannis Samoladas, Ioannis Stamelos, Lefteris Angelis,
and Apostolos Oikonomou, was
published by the highly-respected “Communications of the ACM” in
October 2004 (pp. 83-87).
A minor variation of this paper was reprinted
and made globally accessible in
Programming Languages, Vol. 2, No. 9 - Dec/Jan 2004-2005.
The authors studied almost 6 million lines of code, tracking several programs
over time, using the maintainability index
(chosen by the Software Engineering Institute as the most suitable tool
for measuring the maintainability of systems).
Using their measurements,
they concluded that
OSS/FS “code quality appears to be at least equal and sometimes better
than the quality of [closed source software] code implementing
the same functionality.”
They conjectured that this
“may be due to the motivation of skilled OSS programmers...”
OSS/FS is no panacea; they also found that OSS/FS
“code quality seems to suffer from the very same problems
that have been observed in [closed source software] projects.
Maintainability deterioration over time is a typical phenomenon...
it is reasonable to expect similar behavior from
the OSS projects as they age.”
Clearly, OSS/FS is not a silver bullet; developers of OSS/FS programs
have to work to keep their programs maintainable, and it is difficult to
keep a program maintainable as it grows over time.
OSS/FS was found to have equal and sometimes better maintaintability
than proprietary programs, and that is a very encouraging result.
-
A detailed study of two large programs (the Linux kernel and the
Mozilla web browser) found evidence that OSS/FS development processes
produce more modular designs.
Harvard Business School’s
“Exploring the Structure of Complex Software Designs:
An Empirical Study of Open Source and Proprietary Code”
by Alan MacCormack, John Rusnak, and Carliss Baldwin
(Working Paper Number 05-016)
reports research results that worked to see
if OSS/FS programs tended to have better modularity than proprietary programs.
It’s generally accepted that there are important benefits to greater
modularity, in particular, a more modular system tends to be more
reliable and easier to change over time.
They examined the Linux kernel (developed as an
OSS/FS product), the original Mozilla web browser
(developed as a proprietary product), and then the evolution of Mozilla
after it became OSS/FS.
They found “significant differences in their designs”;
Linux possessed
a more modular architecture than the original proprietary Mozilla,
and the redesigned OSS/FS Mozilla
had a more modular structure than both.
To measure design modularity,
they used a technique called Design Structure Matrices (DSMs)
that identified dependencies between different design elements
(in this case, between files, where calling a function/method of another
file creates a dependency).
They used two different measures using DSMs, which produced agreeing results.
The first measure they computed is a simple one, called “change cost”.
This measures the percentage of elements affected, on average, when
a change is made to one element in the system.
A smaller value is better, since as
this value gets larger, it’s becomes increasingly likely that a
change made will impact a larger number of other components
and have unintended consequences.
This measure isn’t that sensitive to the size of a system
(see their exhibit 7), though obviously as a program gets larger that
percentage implies a larger number of components.
When Mozilla was developed as a proprietary product, and initially released
as OSS/FS, it had the large value of 17.35%.
This means that if a given file is changed, on average, 17.35% of other
files in system depend (directly or indirectly) on that file.
After gaining some familiarity with the code, the OSS/FS developers
decided to improve its design between 1998-10-08 and 1998-12-11.
Once the redesign was complete, the change cost dramatically decreased
down to 2.78%, as you can see:
| Program | Change Cost |
|---|
| Mozilla-1998-04-08 | 17.35% |
| Mozilla-1998-10-08 | 18.00% |
| Mozilla-1998-12-11 | 2.78% |
| Mozilla-1999 | 3.80% |
| Linux-2.1.88 | 3.72% |
| Linux-2.1.105 | 5.16% |
Change cost is a fairly crude measure, though; it doesn’t take into
account
the amount of dependency (measured, say, as
the number of calls from one file to another), and
it doesn’t take clustering into account
(a good design should minimize the communication between clusters more
than communication in general).
Thus, they computed “coordination cost,” an estimated cost of
communicating information between agents developing
each cluster.
This measure is strongly dependent on the size
of the system - after all, it’s easier to coordinate smaller projects.
Thus, to use this as a measure of the quality of a design compared to
another
project, the sizes must be similar (in this case, by the number of
files).
The numbers are unitless, but smaller costs are better.
The researchers identified different circumstances with similar sizes,
so that
the numbers could be compared.
The following table compares Mozilla 1998-04-08 (built almost entirely
by proprietary means) and Mozilla 1998-12-11 (just after the redesign
by OSS/FS developers) with Linux 2.1.105 (built by OSS/FS processes):
| | Linux 2.1.105 | Mozilla 1998-04-08 | Mozilla 1998-12-11 |
|---|
| Number of Source files | 1678 | 1684 | 1508 |
|---|
| Coordination Cost | 20,918,992 | 30,537,703 | 10,234,903 |
|---|
The paper computes numbers for several other cases, but yielding the
same conclusion.
It’d be easy
to argue that kernels are fundamentally different than web browsers,
but that can’t be the right explanation.
When Mozilla was released to the OSS/FS community, it was far worse
by these measures, and the
OSS/FS community actively and consciously worked to improve its modularity.
The browser soon ended up with
a significant and measurable improvement in modularity, better than
the kernel’s,
without an obvious complete loss of functionality.
It appears that at least part of the explanation
is in the OSS/FS development environment.
OSS/FS development is normally distributed worldwide,
with little opportunity for face-to-face communication,
and with many people contributing only part-time.
Thus, “this mode of organization was only possible given that the
design structure, and specifically, the partitioning of design tasks,
was loosely-coupled.”
In addition, the leadership of an OSS/FS project is incentivized
to make architectural decisions that lead to modularity, since
if they didn’t, they wouldn’t be able to attract enough co-developers:
“Without such an architecture,
there was little hope that other contributors could a)
understand enough of the design to contribute in a meaningful way,
and b) develop new features or fix existing defects without affecting
many other parts of the design.”
Although not discussed in the paper, cultural norms may also be a
factor; since the source code is reviewed by others,
developers appear to actively disparage poor designs and praise
highly modular designs.
Again, this does not mean that OSS/FS programs are always more modular;
but it does suggest that there is pressure to make modular
programs in an OSS/FS project.
-
German import company Heinz Tröber found
Linux-based desktops to be far more reliable than Windows desktops;
Windows had a 15% daily failure rate, while Linux has 0%.
Günter Stoverock, the data processing manager at
German import company Heinz Tröber,
reported that they had decided to run its
ERP software on Linux-based systems, instead of Windows,
because Windows was much less reliable.
Stoverock stated that on Windows, “Out of 65 desktops,
around 10 desktops crashed daily...
Employees wasted around 30 minutes, that’s five times 30 minutes per week.”
Note that this is a 15% daily failure rate, and the actual
impacts were almost certainly more severe than simply a loss
of 2 minutes of lost time per reboot.
After all, this generous calculation
ignores the cost of lost time due to lost data (requiring
re-entry), time to restart whatever action they were doing,
and the time for people to regain their focus on what they were doing.
Stoverock then stated
“That’s not acceptable -- we had to do something [to solve this].”
The company switched to Linux desktop systems in 2001, and has had
no downtime at all since (through March 2005).
He reported that
“There are no problems -- in the morning you turn the computer on,
in the afternoon you turn it off -- that’s it.”
I do not have more detailed information than this
about their particular environment and results, which is a significant
limitation of this report.
On the other hand, I found no evidence that they
have any reason to prefer either platform, and it appears that the
functionality and usage was the same on both platforms,
suggesting that this is valid comparison.
Damien Challet and Yann Le Du of the University of Oxford have written a
paper titled
Closed source versus open source in a model of software bug dynamics.
In this paper they develop a model of software bug dynamics
where users, programmers and maintainers interact through a given program.
They then analyzed the model, and found that all other things being equal
(such as number of users, programmers, and quality of programmers),
“debugging in open source projects is always faster than in
closed source projects.”
Of course, there are many anecdotes about Windows reliability vs. Unix.
For example, the
Navy’s “Smart Ship” program caused a complete failure of the
USS Yorktown ship in September 1997.
Whistle-blower Anthony DiGiorgio stated that Windows is
“the source of the Yorktown’s computer problems.”
Ron Redman, deputy technical director of the Fleet Introduction Division
of the Aegis Program Executive Office, said
“there have been numerous software failures associated with [Windows]
NT aboard the Yorktown.”
Redman also said
“Because of politics, some things are being forced on us that
without political pressure we might not do, like Windows NT...
If it were up to me I probably would not have used Windows NT in this
particular application.
If we used Unix, we would have a system that has less
of a tendency to go down.”
Reliability is increasing important in software.
ABI Research 2004 study “Automotive Electronics Systems:
Market Requirements for Microcontrollers, Accelerometers,
Hall Effect and Pressure Sensors” found that
approximately 30% of all automotive warranty issues today are
software and silicon-related.
One problem with reliability measures is that it takes a long time to
gather data on reliability in real-life circumstances.
Thus, there’s more data comparing older Windows editions
to older GNU/Linux editions.
The key is that these comparisons are fair, because they compare
contemporaneous products.
The available evidence suggests that OSS/FS has
a significant edge in reliability, at least in many circumstances.
Comparing GNU/Linux and Microsoft Windows performance on equivalent
hardware has a
history of contentious claims and different results based on
different assumptions.
OSS/FS has at least shown that it’s often competitive, and
in many circumstances it beats the competition.
Performance benchmarks are very sensitive to the assumptions and environment,
so the best benchmark is one you set up yourself to model your intended
environment.
Failing that, you should use unbiased measures, because it’s so easy to
create biased measures.
First, here are a few recent studies
suggesting that some OSS/FS systems beat proprietary competitors
in at least some circumstances:
-
In 2002,
TPC-C database measures found that a Linux based system was faster than
a Windows 2000 based system.
More specifically,
an HP ProLiant DL580 with 32 Intel Xeon 900MHz CPUs
running Oracle 9i R2 Enterprise edition ran faster running on a stock
Red Hat Linux Advanced Server than on
Microsoft Windows 2000 Advanced Server.
You can see the
Linux and
Windows reports;
note that
HP
did not modify the Linux kernel to get these results.
-
PC Magazine’s November 2001 performance tests for file servers found
that Linux with Samba significantly outperformed Windows 2000.
Their article
Performance Tests: File Server Throughput and Response Times
found that Linux with Samba significantly outperformed Windows 2000 Server
when used as a file server for Microsoft’s own network file protocols.
This was true regardless of the number of
simultaneous clients (they tested a range up to 30 clients), and it was true
on the whole range on computers they used
(Pentium II/233MHz with 128MiB RAM, Pentium III/550MHz with 256MiB RAM, and
Pentium III/1GHz with 512MiB RAM, where
MiB is 2^20 bytes).
Indeed, as the machines became more capable the absolute difference grew
more pronounced.
On the fastest hardware while handling
largest number of clients, GNU/Linux’s throughput was about
130 MB/sec vs. Windows’ 78 MB/sec (GNU/Linux was 78% faster).
-
PC Magazine tested file server performance again in April 2002;
Linux with Samba beat Windows 2000 again, but Samba then surpassed
Windows 2000 by about 100% and can handle 4 times as many clients.
PC Magazine published another comparison of Samba and Windows
(a summary is available electronically as
“Samba runs rings around Win2000.”).
They noted that the later Samba software surpasses
the performance of Windows 2000 by about 100 percent under benchmark tests,
and found that Linux and Samba can handle four times as many client systems
as Windows 2000 before performance begins to drop off.
Jay White, IT manager at electronics firm BF Group, said that
Samba is one of the most useful pieces of server software
available for a mixed Windows and Linux environment.
“Our Samba server has been online for 394 days so far.
The total cost is the hardware plus 30 minutes of my time each year,” he said.
Mark Twells, IT coordinator at a large education facility, said,
“We run six Samba servers on a variety of hardware [and] we have
around 1,000 users.”; this certainly excellent evidence of
Samba’s utility.
-
In performance tests by Sys Admin magazine, GNU/Linux beat
Solaris (on Intel), Windows 2000, and FreeBSD.
The article
“Which OS is Fastest for High-Performance Network Applications?”
in the July 2001 edition of
Sys Admin magazine
examined high-performance architectures and found that GNU/Linux
beat its competition when compared with Solaris (on Intel), FreeBSD
(an OSS/FS system), and Windows 2000.
They intentionally ran the systems “out of the box” (untuned),
except for increasing the number of simultaneous TCP/IP connections
(which is necessary for testing multi-threaded and asynchronous applications).
They used the latest versions of OSes and the exact same machine.
They reported (by OS) the results of two different
performance tests.
The FreeBSD developers complained about these tests, noting
that FreeBSD by default emphasizes reliability (not speed) and that
they expected anyone with a significant performance need would do some
tuning first.
Thus,
Sys Admin’s re-did the tests for FreeBSD after tuning FreeBSD.
One change they made was
switching to “asynchronous” mounting, which makes a system faster
(though it increases the risk of data loss in a power failure) -
this is the GNU/Linux default
and easy to change in FreeBSD, so this was a very small and
reasonable modification.
However, they also made many other changes, for example,
they found and compiled in 17 FreeBSD kernel patches and used various
tuning commands.
The other OSes weren’t given the chance to “tune” like this,
so comparing untuned OSes to a tuned FreeBSD isn’t really fair.
In any case, here are their two performance tests:
- Their “real-world” test
measured how quickly large quantities of email
could be sent using their email delivery server (MailEngine).
Up to 100 simultaneous sends there was no difference, but as the number
increased the systems began showing significant differences in their
hourly email delivery speed.
By 500 simultaneous sends GNU/Linux was clearly faster than all except
FreeBSD-tuned, and GNU/Linux remained at the top.
FreeBSD-tuned had similar performance to GNU/Linux
when running 1000 or less simultaneous sends, but FreeBSD-tuned peaked around
1000-1500 simultaneous connections with a steady decline not suffered
by GNU/Linux, and FreeBSD-tuned
had trouble going beyond 3000 simultaneous connections.
By 1500 simultaneous sends, GNU/Linux was sending 1.3 million emails/hour,
while Solaris managed approximately 1 million, and Windows 2000 and
FreeBSD-untuned were around 0.9 million.
- Their “disk I/O test” created, wrote, and read back
10,000 identically-sized files in one directory,
varying the size of the file instances.
Here Solaris was the slowest, with FreeBSD-untuned the second-slowest.
FreeBSD-tuned, Windows 2000, and GNU/Linux
had similar speeds at the smaller file sizes
(in some cases FreeBSD-tuned was faster, e.g., 8k and 16k file size),
but when the file sizes got to 64k to 128k the OSes began
to show significant performance differences; GNU/Linux was the fastest,
then Windows 2000, then FreeBSD.
At 128k, FreeBSD was 16% worse than Windows 2000, and 39% worse than GNU/Linux;
all were faster than FreeBSD-untuned and Solaris.
When totaling these times across file sizes, the results were
GNU/Linux: 542 seconds, Windows 2000: 613 seconds, FreeBSD-tuned: 630 seconds,
FreeBSD-untuned: 2398 seconds, and Solaris: 3990 seconds.
-
GNU/Linux with TUX has produced better SPEC values than Windows/IIS in
several cases, even when given inferior drive configurations.
One organization that tries to develop unbiased benchmarks
is the SPEC Consortium,
which develops and maintains a whole series of benchmarks.
We can compare Microsoft Windows versus GNU/Linux
by comparing SPECweb99 results (which measure web server performance)
on identical hardware if both have undergone the same amount of performance
optimization effort.
Alas, things are not so simple; rarely are the same basic hardware platforms
tested with both OSes, and even when that occurs, as of
July 13, 2001 no exactly identical configurations have been tested
(they differ in ways such as using a different number of hard drives, or
including some faster hard drives).
Using all results available by July 13, 2001,
there were three hardware configurations, all from Dell,
which ran both GNU/Linux (using the TUX web server/accelerator)
and Windows (using IIS) on exactly the same underlying hardware.
Here are the SPECweb99 results as of July 13, 2001 (larger is better),
noting configuration differences:
| System | Windows SPEC Result | Linux SPEC Result |
|---|
| Dell PowerEdge 4400/800, 2 800MHz Pentium III Xeon | 1060 (IIS 5.0, 1 network controller) | 2200 (TUX 1.0, 2 network controllers) |
| Dell PowerEdge 6400/700, 4 700MHz Pentium III Xeon | 1598 (IIS 5.0, 7 9GB 10KRPM drives) | 4200 (TUX 1.0, 5 9GB 10KRPM drives) |
| Dell PowerEdge 8450/700, 8 700MHz Pentium III Xeon |
7300/NC (IIS 5.0, 1 9Gb 10KRPM and 8 16Gb 15KRPM drives) then 8001
(IIS 5.0, 7 9Gb 10KRPM and 1 18Gb 15KRPM drive) |
7500 (TUX 2.0, 5 9Gb 10KRPM drives) |
The first row (the PowerEdge 4400/800) doesn’t really prove anything.
The IIS system has lower performance, but it only had one network
controller and the TUX system has two - so while the TUX system had better
performance, that could simply be because it had two network
connections it could use.
The second entry (the PowerEdge 6400/700) certainly suggests that
GNU/Linux plus TUX really is much better -
the IIS system had two more disk drives available to it (which should increase
performance), but the TUX system had over
twice the IIS system’s performance.
The last entry for the PowerEdge 8450/700 is even more complex.
First, the drives are different - the IIS systems had at least one drive
that revolved more quickly than the TUX systems
(which should give IIS higher performance overall, since the transfer
speed is almost certainly higher).
Also, there were more disk drives (which again should give IIS still higher
performance).
When I originally put this table together showing all data
publicly available in April 2001
(covering the third quarter of 1999 through the first quarter of 2001),
IIS 5.0 (on an 8-processor Dell PowerEdge 8450/700)
had a SPECweb99 value of 7300.
Since that time, Microsoft changed the availability of Microsoft SWC 3.0,
and by SPECweb99 rules, this means that those test results are
“not compliant” (NC).
This is subtle; it’s not that the test itself was invalid, it’s that
Microsoft changed what was available and used the
SPEC Consortium’s own rules to invalidate a test
(possibly because the test results were undesirable to Microsoft).
A retest then occurred, with yet another disk drive configuration,
at which point IIS produced a value of 8001.
However, both of these figures are on clearly better hardware - and
in one circumstance the better hardware didn’t do better.
Thus, in these configurations the GNU/Linux plus TUX system was
given inferior hardware yet still sometimes won on performance.
Since other factors may be involved, it’s hard to judge - there are
pathological situations where “better hardware” can have worse performance,
or there may be another factor not reported that had a more significant effect.
Hopefully in the future there will be many head-to-head tests
in a variety of identical configurations.
Note that
TUX is intended to be used as a “web accelerator” for many circumstances,
where it rapidly handles simple requests and then passes more complex
queries to another server (usually Apache).
I’ve quoted the TUX figures because they’re the recent performance
figures I have available.
As of this time I have no SPECweb99 figures or other recent performance
measures for Apache on GNU/Linux,
or for Apache and TUX together; I also don’t have TUX reliability figures.
I expect that such measures will appear in the future.
-
Low-level benchmarks by IBM found that GNU/Linux had better
performance than Windows for pipes (an input/output mechanism),
and also process and thread creation.
Ed Bradford (manager of Microsoft Premier Support for IBM Software group)
published in October 2001 the study
Pipes in Linux, Windows 2000, and Windows XP.
In this study he examined the
the performance of pipes, a common low-level mechanism for
communicating between program processes.
He found the pipes in
Red Hat 7.1 (with Linux kernel version 2.4.2) had a peak I/O rate of
around 700 MB/sec, with a steady state at near 100 MB/sec for
very large block sizes.
In contrast,
Windows 2000 peaked at 500 MB/sec, with a large block steady state of
80 MB/sec.
Windows XP Professional (evaluation version) was especially disappointing;
its peak I/O rate was only 120 MB/sec, with a stead state of 80 MB/sec, all
on the same platform and all running a GUI.
In February 2002 he published
Managing processes and threads, in which he compared
the performance of
Red Hat Linux 7.2, Windows 2000 Advanced Server (”Win2K”), and
Windows XP Professional (”WinXP”),
all on a Thinkpad 600X with 320MiB of memory.
Linux managed to create over 10,000 threads/second,
while Win2K didn’t quite manage 5,000 threads/second
and WinXP only created 6,000 threads/second.
In process creation, Linux managed 330 processes/second, while
Win2K managed less than 200 processes/second and WinXP less than 160
processes/second.
-
eWeek found in its tests that the OSS/FS program MySQL was
quite comparable to the proprietary Oracle database program,
and the pair outperformed other proprietary programs.
eWeek Labs/PC Labs compared several database packages and
released the results on February 25, 2002.
Comparable performance measures of database programs are actually
quite rare.
As they note,
“database vendors routinely use no-benchmarking clauses in their license
agreements to block publication of benchmarks
of which they do not approve.”
Indeed, to their knowledge, this is the first time a
computer publication has published database benchmark results tested on
the same hardware since PC Magazine did so in October 1993
(almost 9 years earlier).
However, they took the risk and published the results examining
five server databases:
IBM’s DB2 7.2 with FixPack 5,
Microsoft Corp.’s SQL Server 2000 Enterprise Edition with Service Pack 2,
MySQL AB’s MySQL 4.0.1 Max,
Oracle Corp.’s Oracle9i Enterprise Edition 9.0.1.1.1,
and Sybase Inc.’s ASE (Adaptive Server Enterprise) 12.5.0.1.
Their goal was to create a
level playing field to determine which database performed best when used
with a Java-based application server.
The results?
They found that overall Oracle9i and MySQL had
the best performance and scalability;
Oracle9i was slightly ahead of MySQL in most cases, but
Oracle costs far more.
“ASE, DB2, Oracle9i and MySQL finished in a dead heat up to about
550 Web users.
At this point, ASE’s performance leveled off at 500 pages per second,
about 100 pages per second less than Oracle9i’s and MySQL’s leveling-off
point of about 600 pages per second.
DB2’s performance dropped substantially,
leveling off at 200 pages per second under high loads.
Due to its significant JDBC (Java Database Connectivity)
driver problems, Microsoft’s
SQL Server was limited to about 200 pages per second
for the entire test.”
Naturally,
“Manual tuning makes a huge difference with databases - in general,
our final measured throughput was twice as fast as our
initial out-of-the-box test runs.”
In this case, they found that
“SQL Server and MySQL were the easiest to tune,
and Oracle9i was the most difficult because it has so many separate memory
caches that can be adjusted.”
MySQL also demonstrated some significant innovation.
Its performance was due primarily to
its “query cache”, a capability not
included in any other database.
If the text of a query has a byte-for-byte match with a cached query,
MySQL can retrieve the results directly from its cache without compiling
the query, getting locks or doing index accesses.
Obviously, this technique is only effective for tables with few updates,
but it certainly made an impact on this benchmark and is a helpful
optimization for many situations.
MySQL also supports different database engines on
a table-by-table basis; no other tested database had this feature.
They also found that
of the five databases they tested, only Oracle9i and MySQL were able
to run their test application as originally written
for 8 hours without problems.
They had to work around various problems for all the others.
In this case, an OSS/FS program beat most of its proprietary competition
in both performance and reliability (in terms of being able to run
a correctly-written application without problems).
A proprietary program (Oracle) beat it, but barely, and its competitor is
far more expensive.
It certainly is arguable that MySQL is (for this application)
a comparable application worthy of consideration.
MySQL AB
also reports other benchmark results comparing MySQL with other products;
however, since they are not an independent lab, I’m not highlighting
their results here.
-
In February 2003, scientists broke the Internet2 Land Speed Record
using GNU/Linux.
Scientists sent 6.7 GB of uncompressed data at 923 megabits per second
in just 58 seconds from Sunnyvale, California, to Amsterdam -
the equivalent of four hours of DVD-quality movies, using
a transfer speed 3,500 times faster
than a typical household broadband connection.
The team used PCs running Debian GNU/Linux in Amsterdam
and Red Hat Linux in Sunnyvale, California.
-
Benchmarks comparing Sun Solaris x86 and GNU/Linux found many
similarities, but GNU/Linux had double the performance in web
operations.
Tony Bourke’s October 2003 evaluation
Sun Versus Linux: The x86 Smack-down
gave a general review comparing Sun Solaris x86 and Red Hat Linux.
He found that
“Performance was overall similar for most of the metrics tested,
perhaps with Linux in a very slight lead.
However, with the web operations test
(arguably the most important and relevant), Linux is a clear winner.”
He found that, given the same web serving programs and configuration,
GNU/Linux supported over 2000 fetches/second while Solaris x86 supported
less than 1000 fetches/second.
All OSes in active development
are in a constant battle for performance improvements over their rivals.
The history of comparing Windows and GNU/Linux helps put this in perspective:
-
Ziff-Davis found that GNU/Linux with Apache beat
Windows NT 4.0 with IIS by 16%-50% depending on the GNU/Linux distribution.
Ziff-Davis compared Linux and Windows NT’s performance at web serving.
They found that
“Linux with Apache beats NT 4.0 with IIS,
hands down. SuSE, the least effective Linux, is 16%
faster than IIS, and Caldera, the leader, is 50% faster.”
-
Mindcraft
released a report in April 1999 that claimed that
Microsoft Windows NT Server 4.0 is 2.5 times faster than Linux (kernel 2.2)
as a File Server and 3.7 times faster as a Web Server when running on
a 4-CPU SMP system.
Several people and organizations, such
Linux
Weekly News (LWN) and
Dan Kegel,
identified serious problems with this study.
An obvious issue was that NT was specially tuned by Microsoft’s
NT experts, at Microsoft, while GNU/Linux was not tuned at all.
Another issue is that the price/performance wasn’t considered
(nor was total expenditure kept constant - for the same amount of
money, the GNU/Linux system could have had better hardware).
Mindcraft claimed they asked for help, but they didn’t use the documented
methods for getting help nor did they purchase a support contract.
Many were especially offended that even though this study was funded
by Microsoft (one of the contestants) and held at their facility,
neither Mindcraft’s initial announcement nor its paper made
any mention of this conflict-of-interest - and
it could be easily claimed that their configuration
was designed to put GNU/Linux at a disadvantage.
Their configuration was somewhat bizarre - it assumed all web pages
were static
(typical big sites tend to use many dynamically generated pages)
and that there were
100 or so clients connected via 100baseT
(in 1999 a more typical situation would be that
most clients are using slower 28.8 or 56 Kbps modems).
Careful examination of the benchmark did find some legitimate Linux kernel
problems, however. These included a TCP bug,
the lack of “wake one” semantics, and SMP bottlenecks
(see Dan Kegel’s pages
for more information).
The Linux kernel developers began working on the weaknesses identified
by the benchmark.
-
PC Week confirmed that Windows did indeed do better in this
less probable configuration.
In June 30, 1999, Mindcraft released their
Open
Benchmark in conjunction with PC Week.
While this didn’t excuse Mindcraft’s biases,
it did make a convincing case that there were legitimate problems
in the Linux kernel and Apache that made GNU/Linux a
poorer-performing product in this somewhat improbable configuration
(serving static web pages to clients with high-speed connections).
Note that this configuration was considerably different
than Ziff-Davis’s, so the benchmarks don’t necessarily conflict; it’s merely
that different assumptions can produce different results
(as I’ve already stressed).
-
The German magazine c’t found that web sites with NT were better at
static content and dual network connections, but GNU/Linux sites were
better for sites with dynamic content and single connections.
Their article Mixed
Double: Linux and NT as Web Server on the Test Bed
examined Windows NT with IIS against GNU/Linux (kernel 2.2.9)
with Apache on a machine with four Pentium II Xeon CPUs.
They found that the performance winner depended on the situation
(by now that should not be a surprise).
If the web server primarily served static web pages through
two high-performance network cards, NT’s performance was better.
However, they also noted that in sophisticated web sites this
result didn’t apply, because such sites tend to have primarily dynamic content,
and that few sites had this kind of dual-network connection
(when only one network board was available,
GNU/Linux generally had an edge).
They concluded that
“Mindcraft’s result can’t be transferred to situations with
mainly dynamic contents - the
common case in nearly every sophisticated web site...
In the web server areas most relevant for practical use,
Linux and Apache are already ahead by at least one nose.
If the pages don’t come directly from the system’s main memory,
the situation is even reverted to favor Linux and Apache:
Here, the OpenSource movement’s prime products leave
their commercial competitors from Redmond way behind.”
See their paper for more figures and background.
-
Network Computing found that GNU/Linux with Samba ran
at essentially the same speed as Windows for file serving.
In their article
“Is it Time for Linux”,
Network Computing compared Red Hat Linux v5.2 running Samba 2.0.3
against Microsoft Windows NT Server Enterprise Edition on a
Pentium II-based HP NetServer LPr, stressing the machine
with multiple reads and writes of small, medium and large
files over the course of several hours.
For file serving, they discovered only
“negligible performance differences between the two for average workloads...
[and] depending on the degree of tuning performed on each
installation, either system could be made to surpass the other
slightly in terms of file-sharing performance.”
Red Hat Linux slightly outperformed NT on file writes, while NT edged
out Red Hat Linux on massive reads.
Note that their configuration was primarily network-limited;
they stated “At no point were we able to push the CPUs much over 50-percent
utilization-the single NIC, full duplex 100BASE-T environment
wouldn’t allow it.”
They also noted that “examining the cost difference between
the two licenses brings this testing into an entirely new light...
the potential savings on licenses alone is eye-opening.
For example, based on the average street price of $30 for a Windows
NT client license, 100 licenses would cost around $3,000, plus
the cost of an NT server license (around $600). Compare this to
the price of a Red Hat Linux CD, or perhaps even a free
download, and the savings starts to approach the cost of a
low-end workgroup server. Scale that up to a few thousand
clients and you begin to see the savings skyrocket.”
See this paper’s section on
total cost of ownership.
-
The Linux developers’
various efforts to improve performance appear to have paid off.
In June 2000, Dell measured the various SPECweb99 values noted above.
There are other benchmarks available, but I’ve discounted them on
various grounds:
-
A more recent set of articles from eWeek on June 2001, shows some eye-popping
performance numbers for GNU/Linux with TUX.
However, although they compare it to Microsoft IIS, they don’t include
Microsoft’s SWC (Scalable Web Cache), Microsoft’s response to TUX -
and omitting it makes this comparison less balanced.
You can read more at
“Tux: Built for Speed”,
“Smart Coding pays off Big”, and
Kegel’s
detailed remarks.
-
The ZDNet article
Take that! Linux beats MS in benchmark test,
loudly trumpeted that
GNU/Linux was the May 2001 performance leader in the
TPC-H decision support (database) benchmark (“100Gb” category).
However, this result should not be taken very seriously;
the hardware that Linux ran on was more powerful than that
of the runner-up (Windows 2000).
Frankly, the more surprising fact than its top score (which can be easily
explained by the hardware) is its mere measurement at all with this benchmark -
traditionally only Microsoft’s numbers are reported for this benchmark
at this range.
For more information, see
the TPC results.
More information on various benchmarks is available from Kegel’s
NT vs. Linux
Server Benchmark Comparisons,
SPEC, and the
dmoz entry on benchmarking.
Remember, in benchmarking, everything depends on the
configuration and assumptions that you make.
Many systems are constrained by network bandwidth; in such circumstances
buying a faster computer won’t help at all.
Even when network bandwidth isn’t the limitation,
much depends on what the products are designed to do.
Neither Windows nor GNU/Linux do well
in large-scale symmetric multiprocessing (SMP) shared memory
configurations, e.g., for 64-way CPUs with shared memory.
On the other hand, if you want massive distributed non-shared memory,
GNU/Linux does quite well, since you can buy more CPUs with a given amount
of money.
If massive distribution can’t help you and you need very
high performance,
Windows isn’t even in the race;
today Windows runs essentially only on Intel x86 compatible chips,
while GNU/Linux runs
on much higher performance processors as well as the x86.
Which brings us to the topic of scalability, a simple term
with multiple meanings:
-
GNU/Linux and NetBSD (both OSS/FS) support a wider
range of hardware platforms and performance
than any other OS.
Many people mean by “scalability” to answer the question,
“can you use the same software system for both small and large projects?”
Often the implied issue is that you’d like to start with a modest system,
but have the ability to grow the system as needs demand without
costly modifications.
Here OSS/FS is unbeatable; because many people can identify scalability
problems, and because its source code can be optimized for its
platform, the scalability of many OSS/FS products is amazing.
Let’s specifically look at GNU/Linux.
GNU/Linux works on
PDAs
(including the
Agenda
VR3),
obsolete hardware
(so you needn’t throw the hardware away),
common modern PC hardware,
over a dozen different chipsets (not just Intel x86s),
mainframes,
massive clusters,
and a number
of supercomputers.
There’s even a prototype implementation of GNU/Linux on
a wrist watch,
And GNU/Linux runs on a vast number of different CPU chips, including
the x86, Intel Itanium,
ARM, Alpha, IBM AS/400 (midrange), SPARC, MIPS, 68k, and Power PC.
Another OS that widely scales to many other hardware
platforms is
NetBSD.
GNU/Linux is also used in the most powerful computers in the world.
GNU/Linux can be used to support massive parallel processing;
a common approach for doing this is the
Beowulf
architecture.
In June 2001, the 42nd most powerful computer
(according to the
TOP 500 Supercomputer
list, June 2001) was
Sandia’s Linux-based “CPlant”.
By May 2004, the
Lawrence Livermore National Laboratory’s Linux-based “Thunder”
delivered 19.94 teraflops, making it the second fastest on earth
and the most powerful computer in North America.
By November 2004,
IBM’s Linux-based Blue Gene/L supercomputer became the
most powerful supercomputer in the world,
with 91.75 teraflops of peak floating point performance
(as measured by the Linpack Fortran benchmark test)
and 70.72 teraflops of sustained performance.
This system is based on Linux, and only a quarter of its eventual planned size.
Indeed,
IBM plans for the Blue Gene family to eventually
perform a quadrillion calculations per second (one petaflop).
Thus, you can buy a small GNU/Linux or NetBSD system and
grow it as your needs grow;
indeed, you can replace small hardware with massively parallel or
extremely high-speed processors or very different CPU architectures
without switching OSes.
Windows CE scales down to smaller platforms, but Windows simply
does not scale up to the largest computing systems.
Windows used to run on other platforms (such as the Alpha chips), but
in practical terms, Windows is used and supported
almost exclusively on x86 systems.
Many Unix systems (such as Solaris) scale well to specific large platforms,
but not as well to distributed or small platforms.
In short, the most scalable and portable systems available are OSS/FS.
-
OSS/FS development processes can scale to develop large software systems.
At one time it was common to ask
if the OSS/FS process is “scalable,” that is, if OSS/FS
processes could really develop large-scale systems.
Bill Gates’ 1976 “Open Letter to Hobbyists” asked rhetorically,
“Who can afford to do professional work for
nothing? What hobbyist can put three man-years into programming,
finding all bugs, documenting his product, and distribute it for free?”
He presumed these were unanswerable questions - but he was wrong.
See my reports estimating
GNU/Linux’s size.
For Red Hat Linux 6.2, I found the size to be over 17 million source
lines of code (SLOC). Implemented traditionally it would have taken
4,500 person-years and over $600 million to implement this distribution.
For Red Hat Linux 7.1, I found it to have over 30 million SLOC,
representing 8,000 person-years or $1 billion (a “Gigabuck”).
Most developers ascribe to the design principle that components should be
divided into smaller components where practical - a practice also applied
to GNU/Linux - but some components aren’t easily divided, and thus some
components are quite large themselves (e.g., over 2 million lines of code
for the kernel, mostly in device drivers).
By October 2002,
Sourceforge.net announced that it had surpassed 500,000 registered users
and supported almost 50,000 OSS/FS projects - and a vast number of
OSS/FS projects don’t use SourceForge.
Thus, it’s no longer reasonable to argue that OSS/FS cannot scale to
develop large systems -- because it clearly can.
Quantitatively measuring security is very difficult.
However, here are a few attempts to do so, and they suggest
that OSS/FS is often superior to proprietary systems, at least in some cases.
I’ll concentrate on comparing OSS/FS to Windows systems, since as
noted above other proprietary systems are increasingly
including OSS/FS components (making comparisons more difficult).
-
J.S. Wurzler Underwriting Managers’ “hacker insurance” costs 5-15% more
if Windows is used instead of Unix or GNU/Linux for Internet operation.
At least one insurance company has indicated that Windows NT is
less secure than Unix or GNU/Linux systems, resulting in higher premiums
for Windows-based systems.
It’s often difficult to find out when a company has been successfully
cracked; companies often don’t want to divulge such information to
the public for a variety of reasons.
Indeed, if consumers or business partners lost trust in a company,
the resulting loss might be much greater than the original attack.
However, insurance companies that insure against cracking can require
that they get such information (as a condition of coverage),
and can compute future premiums based on that knowledge.
According to Cnet,
Okemos, Mich.-based J.S. Wurzler Underwriting Managers,
one of the earliest agencies to offer “hacker insurance”
(and thus more likely to have historical data for premium calculation),
has begun
charging its clients anywhere from 5 to 15 percent more if
they use Microsoft’s Windows NT software
instead of Unix or GNU/Linux for their Internet operations.
Walter Kopf, senior vice president of underwriting, said that
“We have found out that the possibility for loss
is greater using the NT system.”
He also said the
decision is based on findings from hundreds of security assessments
the company has done on their small and midsize business clients over
the past couple of years.
-
Most defaced web sites are hosted by Windows,
and Windows sites are disproportionately defaced more often than
explained by its market share.
Another way to look at security is to look at the OS
used by defaced web sites, and compare them to their market share.
A “defaced” web site is a site that has been broken into and has its
content changed (usually in a fairly obvious way, since subtle modifications
are often not reported).
The advantage of this measure is that unlike other kinds of security
break-ins (which are often “hushed up”), it’s often very difficult
for victims to hide the fact that they’ve been successfully attacked.
Historically, this information was maintained by Attrition.org.
A summary can be found in
James Middleton’s article,
with the actual data found in
Attrition.org’s
web site.
Attrition.org’s data showed that 59% of defaced systems
ran Windows, 21% Linux, 8% Solaris, 6% BSD, and 6% all others in the
period of August 1999 through December 2000.
Thus, Windows systems have had nearly 3 times as many defacements as
GNU/Linux systems.
This would make sense if there were 3 times as many Windows systems,
but no matter which figures you use, that’s simply not true.
Of course, not all sites are broken through their web server and OS -
many are broken through exposed passwords, bad web application programming,
and so on.
But if this is so, why is there such a big difference in the number
of defacements based on the OS?
No doubt some other reasons could be put forward
(this data only shows a correlation not a cause), but
this certainly suggests that OSS/FS can have better security.
Attrition.org has decided to abandon keeping track
of this information due to the difficulty of keeping up with the
sheer volume of broken sites, and it appeared that tracking this
information wouldn’t be possible.
However, defaced.alldas.de
has decided to perform this valuable service.
Their recent reports show that this trend has continued;
on July 12, 2001, they report that
66.09% of defaced sites ran Windows, compared to
17.01% for GNU/Linux, out of 20,260 defaced websites.
-
Unpatched Linux systems last longer than unpatched Windows systems,
according to a combination of studies from the Honeynet Project, AOL,
and others.
As
summarized in C|Net and
Vnunet,
and described in more detail in
The Honeynet Project’s
report “Know Your Enemy: Trend Analysis” (17 December 2004),
as of 2004 the
average Linux system lasts three months before being compromised,
(a significant increase from the 72 hours life span of a Linux system
in 2001).
Unpatched Windows systems continue to be compromised far more quickly,
sometimes within minutes.
This data on Windows compromise is consistent with other studies.
Avantgarde found that Windows did not last long, and one
unpatched Windows XP system (pre-SP2) only lasted 4 minutes on the Internet
before it was compromised. and in general did not last long
(see also
USAToday’s “Unprotected PCs can be hijacked in minutes”, which
worked with AvantGarde).
Note, however, that users who install Windows Service Pack 2
have much less risk than previous versions of Windows.
Symantec’s Internet Security Threat Report (January 1-June 30, 2004),
The
Internet Storm Center’s Survival Time History
claims that by December 2004 a Windows survival time of 18 minutes.
-
The Bugtraq vulnerability database suggests that the least vulnerable
OS is OSS/FS, and that all the OSS/FS OSes in its
study were less vulnerable than Windows in 1999-2000, unless you counted
every GNU/Linux vulnerability multiple times.
One approach to examining security is to use a vulnerability database;
an analysis of one database is the
Bugtraq
Vulnerability Database Statistics page.
As of September 17, 2000, here are the total number of
vulnerabilities for some leading OSes:
| OS | 1997 | 1998 | 1999 | 2000 |
| Debian GNU/Linux | 2 | 2 | 30 | 20 |
| OpenBSD | 1 | 2 | 4 | 7 |
| Red Hat Linux | 5 | 10 | 41 | 40 |
| Solaris | 24 | 31 | 34 | 9 |
| Windows NT/2000 | 4 | 7 | 99 | 85 |
You shouldn’t take these numbers very seriously.
Some vulnerabilities are more important than others (some may provide little
if exploited or only be vulnerable in unlikely circumstances),
and some vulnerabilities are being actively exploited (while others have
already been fixed before exploitation).
OSS/FS OSes tend to include many applications that are
usually sold separately in proprietary systems (including Windows and
Solaris).
For example,
Red Hat 7.1 includes two relational database systems, two word processors,
two spreadsheet programs, two web servers, and many text editors.
In addition, in the open source world, vulnerabilities are discussed
publicly, so vulnerabilities may be identified for
software still in development (e.g., “beta” software).
Those with small market shares are likely to have less analysis.
The “small market share” comment won’t work with GNU/Linux,
since GNU/Linux is the #1 or #2 server OS (depending on
how you count them).
Still, this clearly shows that the three OSS/FS OSes listed
(Debian GNU/Linux, OpenBSD, and Red Hat Linux) did much better by this measure
than Windows in 1999 and (so far) in 2000.
Even if a bizarre GNU/Linux distribution was created explicitly to
duplicate all vulnerabilities present in any major GNU/Linux distribution,
this intentionally bad GNU/Linux distribution would
still do better than Windows (it would have
88 vulnerabilities in 1999, vs. 99 in Windows).
The best results were for OpenBSD, an OSS/FS OS that
for years has been specifically focused on security.
It could be argued that its smaller number of vulnerabilities is because
of its rarer deployment, but the simplest explanation is that OpenBSD
has focused strongly on security - and achieved it better than the rest.
This data is partly of interest because
various reporters make the same mistake:
counting the same vulnerability multiple times.
One
journalist, Fred Moody, failed to understand his data sources - he used
these figures to try to show show that GNU/Linux had worse security.
He took these numbers and then added the GNU/Linux ones so each Linux
vulnerability was counted at least twice (once for every distribution it
applied to plus one more).
By using these nonsensical figures
he declared that GNU/Linux was worse than anything.
If you read his article, you also must read
the rebuttal by the manager of the Microsoft Focus Area at SecurityFocus to
understand why the journalist’s article was so wrong.
In 2002,
another journalist
(James Middleton) made the same mistake, apparently not learning from
prior work.
Middleton counted the same Linux vulnerability up to four times.
What’s bizarre is that he even reported the individual numbers showing
that specific Linux systems were actually more secure by
using Bugtraq’s vulnerability list through August 2001, and somehow
he didn’t realize what it meant.
He noted that
Windows NT/2000 suffered 42 vulnerabilities, while
Mandrake Linux 7.2 (now Mandriva) notched up 33 vulnerabilities,
Red Hat Linux 7.0 suffered 28, Mandrake 7.1 had 27 and Debian 2.2 had 26.
In short, all of the GNU/Linux distributions had significantly fewer
vulnerabilities by this count.
It’s not fully clear what was being considered
as being “in” the
OS in this case, which makes a difference.
There are some hints that vulnerabilities in some
Windows-based products (such as Exchange)
were not counted, while vulnerabilities in GNU/Linux products with
the same functionality (e.g., sendmail) were counted.
It also appears that many of the Windows attacks were more dangerous
(which were often attacks that could be invoked by remote attackers
and were actively exploited),
as compared to the GNU/Linux ones (which were often attacks that could
only be invoked by local users and were not actively exploited at the time).
I would appreciate links to someone who’s analyzed these issues more
carefully.
The funny thing is that given all these errors, the paper gives evidence
that the GNU/Linux distributions were more secure.
The September 30, 2002
VNUnet.com article “Honeymoon over for Linux Users”,
claims that there are more “Linux bugs” than “Microsoft bugs.”
It quotes
X-Force (the US-based monitoring group of security software
firm Internet Security Systems), and summarizes by saying that
in 2001 the centre found 149 bugs in Microsoft software compared to
309 for Linux, and in 2002 485 Linux bugs were found
compared to Microsoft’s 202.
However,
Linux Weekly News discovered
and reported serious flaws in these figures:
- “Each distribution is counted independently. The same vulnerability in
five distributions will count as five separate vulnerabilities.
This practice drastically overstates the number of reported Linux problems.
- Linux vulnerabilities include those in applications (i.e. PostgreSQL)
which are not part of a standard Windows system.
- Most Linux vulnerabilities are found through code audits
and similar efforts; they are patched and reported before any exploits
happen.
Any Windows bugs found through similar audits are fixed silently
and do not appear in these counts.
Indeed, assuming that the vulnerabilities were only counted three times
(and thus dividing by only 3) would show Linux as having a better result,
never mind the fact that there are more than 3 Linux distributions and
the other factors noted by Linux Weekly News.
Indeed, as noted in Bruce Schneier’s
Crypto-gram
of September 15, 2000, vulnerabilities are affected by other
things such as how many attackers exploit the vulnerability,
the speed at which a fix is released by a vendor, and
the speed at which they’re applied by administrators.
Nobody’s system is invincible.
A more recent
analysis by John McCormick in Tech Republic
compared
Windows and Linux vulnerabilities using
numbers through September 2001.
This is an interesting analysis, showing that although Windows NT lead
in the number of vulnerabilities in 2000, using the 2001 numbers
through September 2001, Windows 2000 had moved to the “middle of the pack”
(with some Linux systems having more, and others having fewer,
vulnerabilities).
However, it appears that in these numbers, bugs in Linux applications
have been counted with Linux, while bugs in Windows applications haven’t -
and if that’s so, this isn’t really a fair comparison.
As noted above, typical Linux distributions bundle
many applications that are separately purchased from Microsoft.
-
Red Hat (an OSS/FS vendor) responded more rapidly than Microsoft
or Sun to advisories; Sun had fewer advisories to respond to yet took
the longest to respond.
Another data point is that SecurityPortal has compiled a
list
of the time it takes for vendors to respond to vulnerabilities.
They concluded that:
How did our contestants [fare]?
Red Hat had the best score, with 348 recess days on 31 advisories,
for an average of 11.23 days from bug to patch.
Microsoft had 982 recess days on 61 advisories,
averaging 16.10 days from bug to patch.
Sun proved itself to be very slow, although
having only 8 advisories it accumulated 716 recess days,
a whopping three months to fix each bug on average.
Their table of data for 1999 is as shown:
| 1999 Advisory Analysis |
| Vendor |
Total Days, Hacker Recess |
Total Advisories |
Recess Days/Advisory |
| Red Hat | 348 |
31 |
11.23 |
| Microsoft | 982 |
61 |
16.10 |
| Sun | 716 |
8 |
89.50 |
|
Clearly this table uses a different method for counting security problems
than the prior table.
Of the three noted here, Sun’s Solaris had the fewest vulnerabilities,
but it took by far the longest to fix security problems identified.
Red Hat was the fastest at fixing security problems, and placed in the
middle of these three in number of vulnerabilities.
It’s worth noting that the OpenBSD OS (which is
OSS/FS) had fewer reported vulnerabilities than all of these.
Clearly, having a proprietary OS doesn’t mean you’re
more secure - Microsoft had the largest number of security advisories,
by far, using either counting method.
More recent examples seem to confirm this;
on September 30, 2002,
eWeek Labs’
article “Open Source Quicker at Fixing Flaws” listed specific examples
of more rapid response.
This article can be paraphrased as follows:
In June 2002, a serious flaw was found in the Apache Web server;
the Apache Software Foundation made
a patch available two days after the Web server hole was announced.
In September 2002, a flaw was announced in
OpenSSL and a patch was available the same day.
In contrast,
a serious flaw was found in Windows XP
that made it possible to delete files on a system using a URL;
Microsoft quietly fixed this problem in Windows XP Service Pack 1
without notifying users of the problem.
A more direct comparison can be seen in how Microsoft
and the KDE Project responded to an SSL (Secure Sockets Layer) vulnerability
that made the Internet Explorer and Konqueror browsers,
respectively, potential tools for stealing data such as credit card information.
The day the SSL vulnerability was announced, KDE provided a patch.
Later that week, Microsoft posted a memo on its TechNet site basically
downplaying the problem.
The article
Linux Security Holes Opened and Closed makes the same argument:
OSS/FS systems fix problems more rapidly, reducing the time available
for attackers to exploit them.
In an August 18, 2004 interview,
Symantec’s chief technology officer Robert Clyde
argued that proprietary vendors were more reliable for fixing problems
within a fixed timescale, and that he didn’t know of a single vendor
who would sit on a vulnerability.
Yet the day before (August 17),
an eWeek article revealed that
Oracle waited 8 months to fix a vulnerability.
And Microsoft waited 9 months to fix a critical IE vulnerability
(and only fixed it after it was being actively exploited in 2004).
Proprietary vendors are certainly not winning prizes for
reliably and rapidly fixing security vulnerabilities.
-
A 2002 survey of developers
found that GNU/Linux systems are relatively immune from attacks from outsiders.
Evans Data Corp.’s
Spring 2002 Linux Developer Survey
surveyed over 400 GNU/Linux developers,
and found that Linux systems are relatively immune from attacks from outsiders.
Even though computer attacks have almost doubled annually since 1988
(according to CERT), 78% of the respondents to the GNU/Linux developers
survey have never experienced an unwanted intrusion
and 94% have operated virus-free.
Clearly, the survey shows that GNU/Linux “doesn’t get broken into
very often and is even less frequently targeted by viruses,”
according to Jeff Child (Evans Data Corp.’s Linux Analyst);
and claims that
“Linux systems are relatively immune from attacks from outsiders.”
Child notes that it’s much harder to hack a knowledgeable owner’s system
(and most Linux developers have hands-on, technical knowledge)
and that because there are fewer desktop GNU/Linux systems there are fewer
viruses being created to attack GNU/Linux.
The developers being surveyed attributed the low incidence of attacks to
the Open Source Software (OSS) environment;
“more than 84% of Linux developers believe that Linux
is inherently more secure than software not
created in an OSS environment,”
and they ranked “Linux’s security roughly comparable in security
to Solaris and AIX ...
and above any of the Windows platforms by a significant margin.”
-
Apache has a better security record than Microsoft’s IIS, as measured
by reports of serious vulnerabilities.
Eweek’s July 20, 2001 article
“Apache avoids most security woes” examined security advisories
dating back to Apache 1.0.
They found that Apache’s last serious security problem
(one where remote attackers could run arbitrary code on the server)
was announced in January 1997.
A group of less serious problems (including a buffer
overflow in the server’s logresolve utility) was
announced and fixed in January 1998 with Apache
1.2.5. In the three and a half years since then,
Apache’s only remote security problems have been a
handful of denial-of-service and information leakage
problems (where attackers can see files or directory listings they shouldn’t).
In contrast, in the article
“IT bugs out over IIS security,” eWeek determined that
Microsoft has issued
21 security bulletins for IIS from January 2000 through June 2001.
Determining what this number means is a little difficult, and the article
doesn’t discuss these complexities,
so I examined these bulletins to find their true significance.
Not all of the bulletins have the same significance, so just stating that
there were “21 bulletins” doesn’t give the whole picture.
However, it’s clear that several of these
bulletins discuss dangerous vulnerabilities
that allow an external user to gain control over the system.
I count 5 bulletins on such highly dangerous vulnerabilities
for IIS 5.0 (in the period from January 2000 through June 2001), and
prior to that time, I count 3 such bulletins for IIS 4.0
(in the period of June 1998 through December 1999).
Feel free to examine the bulletins yourself; they are
MS01-033, MS01-026, MS01-025, MS01-023, MS00-086,
MS99-025, MS99-019, and MS99-003.
The Code Red
worm, for example, exploited a vast number of IIS sites through
the vulnerabilities identified in the June 2001 security bulletin MS01-033.
In short, by totaling the number of reports of dangerous
vulnerabilities (that allow attackers to execute arbitrary code),
I find a total of 8 bulletins for IIS from June 1998 through
June 2001, while Apache had zero such vulnerabilities for that time
period.
Apache’s last such report was in January 1998, and that one
affected the log analyzer not the web server itself.
As was noted above, the last such dangerous vulnerability in Apache itself
was announced in January 1997.
It’s time-consuming to do this kind of analysis, so I haven’t repeated
the effort more recently.
However, it’s worth noting
eWeek’s April 10, 2002 article
noting that ten more IIS flaws have been found
in IIS Server 4.0, 5.0, and 5.1, some of which would
allow attackers to crash the IIS service or allow the
attacker to run whatever code he chooses.
Even this doesn’t give the full story, however; a vulnerability in IIS
tends to be far more dangerous than an equivalent vulnerability in Apache,
because Apache wisely follows the good security practice of
“least privilege.”
IIS is designed so that anyone who takes over IIS can take over
the whole system, performing actions such as
reading, modifying, or erasing any file on the system.
In contrast, Apache is installed with very few privileges by default, so
even taking over Apache gives attackers relatively few
privileges. For example, cracking Apache does not give attackers the
right to modify or erase most files.
This is still not good, of course, and an attacker may be able to
find another vulnerability to give them unlimited access, but an Apache
system presents more challenges to an attacker than IIS.
The article claims there are four reasons for Apache’s strong security,
and three of these reasons are simply good security practices.
Apache installs very few server extensions by default
(a “minimalist” approach),
all server components run as a non-privileged user
(supporting “least privilege” as noted above), and
all configuration settings are centralized
(making it easy for administrators to know what’s going on).
However, the article also claims that one of the main reasons Apache is
more secure than IIS is that its
“source code for core server files is well-scrutinized,” a task that
is made much easier by being OSS/FS, and it could be argued that OSS/FS
encourages the other good security practices.
Simple vulnerability notice counts are an inadequate metric for security.
A vendor could intentionally release fewer bulletins - but since Apache’s
code and its security is publicly discussed, it seems very unlikely that
Apache is deliberately underreporting security vulnerabilities.
Fewer vulnerability notices could result if the product isn’t well scrutinized
or is rarely used - but this simply isn’t true for Apache.
Even the trend line isn’t encouraging - using the months of the bulletins
(2/99, 6/99, 7/99, 11/00, three in 5/01, and 6/01), I find the
time in months between new major IIS vulnerability announcements to be
4, 1, 18, 6, 0, 0, 1, and 3 as of September 2001;
this compares to 12 and 44 as of September 2001 for Apache.
Given these trends, it looks like IIS’s security is slowly improving,
but it has little likelihood of meeting Apache’s security in the near future.
Indeed, these vulnerability counts are corroborated by other measures such
as the web site defacement rates.
The issue here isn’t whether or not a given program is invincible
(what nonsense!) - the issue is which is more likely to resist
future attacks, based on past performance.
It’s clear that the OSS/FS Apache has much a better security record
than the proprietary IIS, so
much so that Gartner Group decided to make an unusual recommendation
(described below).
-
IIS was attacked 1,400 times more frequently than Apache in 2001,
and Windows was attacked more than all versions of Unix.
SecurityFocus co-founder and CEO Arthur Wong reported an analysis of
the various vulnerabilities and attacks (based on SecurityFocus’s data) in
the February 2002 article
RSA: Security in 2002 worse than 2001, exec says.
IIS was attacked 17 million times, but Apache was attacked only 12,000
times. This is a stunning comparison, since there are about twice as
many Apache systems on the Internet. In 2001, Windows systems were
attacked 31 million times, while Unix systems were attacked 22 million times.
See the article for more information.
-
The Gartner Group is recommending that businesses switch from
Microsoft IIS to Apache or iPlanet due to IIS’s poor security track record,
noting that enterprises had spent $1.2 billion simply fixing Code
Red (IIS-related) vulnerabilities by July 2001.
Microsoft’s IIS has such a bad security record that in September 2001,
Gartner Group announced a recommendation that
“businesses hit by both Code Red and Nimda immediately investigate
alternatives to IIS,
including moving Web applications to Web server software from
other vendors such as iPlanet and Apache.
Although those Web servers have required some security patches, they
have much better security records than IIS and are not under active
attack by the vast number of virus and worm writers.”
Microsoft is sometimes a Gartner Group customer, so this announcement
is especially surprising.
In a background
document by Gartner,
they discuss Code Red’s impacts further.
By July 2001, Computer Economics (a research firm) estimated that
enterprises worldwide had spent $1.2 billion fixing vulnerabilities in
their IT systems that Code Red could exploit (remember, Code Red is designed
to only attack IIS systems; systems such as Apache are immune).
To be fair, Gartner correctly noted that the problem is not just that
IIS has vulnerabilities; part of the problem is that enterprises using IIS
are not keeping their IT security up to date, and Gartner openly wondered why
this was the case.
However, Gartner also asked the question, “why do Microsoft’s software
products continue to provide easily exploited openings for such attacks?”
This was prescient, since soon after this the “Nimba” attack surfaced
which attacked IIS, Microsoft Outlook, and other Microsoft products.
A brief aside is in order here.
Microsoft spokesman Jim Desler tried to counter Gartner’s recommendation,
trying to label it as “extreme” and
saying that “serious security vulnerabilities have been found in
all Web server products and platforms.. this is an industry-wide challenge.”
While true, this isn’t the whole truth. As Gartner points out,
“IIS has a lot more security vulnerabilities than other products
and requires more care and feeding.”
It makes sense to select the product with the best security
track record, even if no product has a perfect record.
-
The majority of the most serious security problems
only apply to Microsoft’s products, and not to OSS/FS products, as suggested
by the CERT/CC’s “most frequent, high-impact types of
security incidents and vulnerabilities” and the ICAT database.
Some security vulnerabilities are more important than others, for a
variety of reasons.
Thus, some analysis centers try to determine what’s “most important,”
and their results suggest that OSS/FS just doesn’t have as many vulnerabilities.
The CERT Coordination Center (CERT/CC) is federally funded to study
security vulnerabilities and perform related activities such as publishing
security alerts.
I sampled their list of
“current activity” of the most frequent, high-impact security
incidents and vulnerabilities on September 24, 2001,
and found yet more evidence
that Microsoft’s products have poor security compared to others
(including OSS/FS).
Four of the six most important security vulnerabilities
were specific to Microsoft:
W32/Nimda, W32/Sircam, cache corruption on Microsoft DNS servers, and
“Code Red” related activities.
Only one of the six items primarily affected non-Microsoft products
(a buffer overflow in telnetd); while this vulnerability is
important, it’s worth noting that many open source systems
(such as Red Hat 7.1) normally don’t enable
this service (telnet) in the first place and thus are less likely to be
vulnerable.
The sixth item (“scans and probes”) is a general note that there is
a great deal of scanning and probing on the Internet, and that there are
many potential vulnerabilities in all systems.
Thus, 4 of 6 issues are high-impact vulnerabilities are specific to Microsoft,
1 of 6 are vulnerabilities primarily affecting Unix-like systems
(including OSS/FS OSes),
and 1 of 6 is a general notice about scanning.
Again, it’s not that OSS/FS products never have security vulnerabilities -
but they seem to have fewer of them.
The ICAT system provides a searchable
index and ranking for the vulnerabilities cross-references by CVE.
I sampled its top ten list on December 19, 2001; this top ten list
is defined by the number of requests made for a vulnerability
in ICAT (and including only vulnerabilities within the last year).
In this case, 8 of the top 10 vulnerabilities only affect proprietary systems
(in all cases, Windows).
Only 2 of 10 affect OSS/FS systems (#6, CAN-2001-0001, a weakness in
PHP-Nuke 4.4, and #8, CVE-2001-0013, a new vulnerability found in an
old version of BIND - BIND 4).
Obviously, by itself this doesn’t prove that there are fewer serious
vulnerabilities in OSS/FS programs, but it is suggestive of it.
-
An analysis of security reports by Nicholas Petreley
found that a much larger percentage of Windows vulnerabilities
are critical compared to Red Hat Linux.
In October 2004, Nicholas Petreley’s paper
“Security Report: Windows vs Linux”
(available in
HTML
or
PDF)
found that Windows vulnerabilities are far more likely to be
serious than vulnerabilities in Red Hat Linux.
He examined the 40 most recent patches/vulnerabilities listed for
Microsoft Windows Server 2003 vs. Red Hat Enterprise Linux AS v.3,
as reported by each vendor’s website.
He then used a metric to score their severity, and by that measure,
50% of the Windows vulnerabilities are critical, compared to 10%
being critical in Red Hat.
There’s an interesting twist here;
Microsoft claims that certain vulnerabilities aren’t as serious as
long as an administrator doesn’t change certain settings.
But as Petreley notes,
“it is nearly inconceivable that anyone who uses Windows Server 2003
will leave the [Windows Server 2003] settings ... unchanged.
These settings make the Internet Explorer browser nearly
useless to the server administrator who wants to perform
any browser-based administrative tasks, download updates, etc.
To lower the severity rank based on the assumption that
Windows Server 2003 users will leave these default settings
as they are is a fantasy, at best.”
Also, Microsoft presumes that “Users” are never “Administrators”, a
very doubtful assumption on a Microsoft Windows server.
If you accept these implausible claims, the percentage drops to 40%,
which is still larger than Red Hat’s.
Microsoft assigns its own criticality levels (Red Hat doesn’t), but even
using Microsoft’s reporting level things are worse;
38% of the patched programs are rated as Critical by Microsoft.
He also did some analysis of the CERT database; while that analysis
was more limited, that still suggested that Linux vulnerabilities
tended to be less severe.
The article goes on to argue against what it terms “myths.”
Petreley also argues that the reason for this difference is that Linux-based
systems have a far better design for security than Windows systems.
His design argument makes four statements:
Linux-based systems are
based on a long history of well fleshed-out multi-user design,
they are modular by design (not monolithic),
they are not constrained by an RPC model (that unnecessarily enables
external control of internal functions), and
Linux servers are ideally designed for headless non-local administration.
This study didn’t try to determine how many critical vulnerabilities
there have been overall in the same period, which is a weakness of the
study. And Petreley is certainly an advocate of GNU/Linux systems.
Still, this report makes a plausible case that there is a difference
in design and/or development process
that makes GNU/Linux vulnerabilities less severe than
Microsoft Windows vulnerabilies.
-
Computer viruses are overwhelmingly more prevalent
on Windows than any other system.
Virus infection has been a major cost to users of Microsoft Windows.
The LoveLetter virus alone is estimated to have cost $960 million
in direct costs and $7.7 billion in lost productivity,
and the anti-virus software industry sales total nearly $1 billion annually.
Dr Nic Peeling and Dr Julian Satchell’s
Analysis of the Impact of Open Source Software
includes an analysis of the various data sources for virus counts,
noting the disproportionate vulnerability of Windows systems.
Here is what they said:
The numbers differ in detail, but all sources agree that computer
viruses are overwhelmingly more prevalent on Windows than any other system.
There are about 60,000 viruses known for Windows,
40 or so for the Macintosh, about 5 for commercial Unix versions,
and perhaps 40 for Linux.
Most of the Windows viruses are not important,
but many hundreds have caused widespread damage.
Two or three of the Macintosh viruses were widespread
enough to be of importance. None of the Unix or
Linux viruses became widespread - most were confined to the laboratory.
Many have noted that one reason Windows is attacked more often is
simply because there are so many Windows systems in use.
Windows is an attractive target for virus writers simply
because it is in such widespread use.
For a virus to spread, it must transmit itself to
other susceptible computers; on average,
each infection must cause at least one more.
The ubiquity of Windows machines makes it easier
for this threshold to be reached.
There may be a darker reason: there are many who do not like Microsoft’s
business practices, and perhaps this contributes to the problem.
Some of Microsoft’s business practices have been proven in court to be
illegal, but the U.S. government appears unwilling to effectively punish
or stop those practices.
Some computer literate people may be taking their frustration out
on users of Microsoft’s product.
This is absolutely wrong, and in most countries illegal.
It is extremely unethical to attack an innocent user of a Microsoft
product simply because of Microsoft’s policies,
and I condemn such behavior.
At this point, although this has been speculated many times, I have
not found any evidence that this is a widespread motivator for
actual attacks.
On the other hand, if you are choosing products, do you really
want to choose the product whom people may have a vendetta against?
However, the reasons given above don’t explain the
disproportionate vulnerability of Microsoft’s products.
A simpler explanation, and one that is easily proven, is that
Microsoft has made many design choices over many years in their
products that have rendered them fundamentally less secure,
and this has made their products a much easier target than many other systems.
Even
Microsoft’s
Craig Mundie admitted that their products
were “less secure than they could have been”
because they were “designing with features in mind rather than security” --
even though most people didn’t use those new features.
Examples include executing start-up macros in Word (even though
users routinely view documents developed by untrustworthy sources),
executing attachments in Outlook, and the lack of write protection on
system directories in Windows 3.1/95/98.
This may be because Microsoft has assumed in the past that customers
will buy their products whether or not Microsoft secures them.
After all, until recently there’s been little competition, so there was
no need to spend money on “invisible” attributes such as security.
It’s also possible that Microsoft is still trying to adjust to an
Internet-based world;
the Internet would not have developed as it has without Unix-like systems,
which have supported the Internet standards for decades,
while for many years Microsoft ignored the Internet and then
suddenly had to play “catch-up” in the early 1990s.
Microsoft has sometimes claimed that they can’t secure their products
because they
want to ensure that their products are “easy to use”.
While it’s true that some security
features can make a product harder to use,
usually a secured product can be just as easy to use if the
security features are carefully designed into the product.
Besides, what’s so easy to use about a system that must be reformatted
and reinstalled every few months because yet another virus got in?
(This is a problem made worse because
Microsoft plans to require people to call Microsoft to gain permission
simply to reinstall the operating system they bought.)
But for whatever the reason, it’s demonstrably true that
Microsoft’s designers have in the past made decisions that made
their products’ security much weaker than other systems.
Microsoft has recently declared that they are working hard to improve
their products’ security; I have hopes that they will improve, and I
see some encouraging signs, but it’s like to take many years
to really secure their products.
In contrast,
while it’s possible to write a virus for OSS/FS OSes, their design
makes it more difficult for viruses to spread... showing that
Microsoft’s design decisions were not inevitable.
It appears that
OSS/FS developers tend to select design choices that limit the damage
of viruses, probably in part because their code is subject to
public inspection and comment (and redicule, if deserving of it).
For example,
OSS/FS programs generally do not support attacker-controlled
start-up macros, nor do they usually support easy execution
of mail attachments from attackers.
Also, leading OSS/FS OSes (such as GNU/Linux and the *BSDs) have always had
write protection on system directories, making it more difficult for
certain attacks to spread.
Another discussion on why viruses don’t seem to significantly
affect OSS/FS systems is available from Roaring Penguin.
OSS/FS systems are not immune to malicious code,
but they are certainly more resistant.
-
Surveys report that GNU/Linux systems experience fewer viruses and
successful cracks.
In July 2004,
Evans Data’s Summer 2004 Linux Development Survey
reported that 92% of their Linux systems have never been infected with a virus,
and 78% that their Linux systems have never been cracked (called “hacked”
in the report).
This contrasts with their Spring 2004 survey, where only 40% non-Linux
users reported no security breach; indeed, 32% non-Linux users experienced
three or more breaches.
-
According to a June 2004 study by Sandvine, 80% of all spam is sent by
infected Windows PCs.
80% of all spam comes from
computers contaminated with Trojan horse infections,
according to a
study by network management firm Sandvine.
Trojans and worms with backdoor components
turn infected PCs into drones in vast networks of compromised zombie PCs.
Sandvine identified subscribers bypassing their home mail servers
and contacting many mail servers within a short period of time
over sustained periods - i.e., spammers.
It also looked at SMTP error messages returned
to clarify the total volume of spam.
They then compared this with the messages passing through the service
provider’s mail system.
Sandvine’s preliminary analysis has shown that the most active Trojans
for spamming purposes are the Migmaf and SoBig variants; note that
these are Windows-only attacks.
Indeed, since almost all successful trojans and worms are those that
attack Windows systems, it appears that this problem
is essentially due to Windows systems.
-
National Cyber Security Alliance’s study of May 2003 reported that
91% of Broadband users have spyware on their home computers running
proprietary operating systems; in contrast, there’s no evidence of
that this is an issue for OSS/FS systems.
America Online, Inc. conducted a study for the
National Cyber Security Alliance.
Its results,
“Fast and Present Danger: In-Home Study on Broadband Security among
American Consumers” (May 2003)
produces some interesting results, in particular, they found that
“91% of Broadband Users Have Spyware Lurking on Home Computers”.
Their study method did not appear to permit collection of data from
OSS/FS systems, and spyware systems are essentially
nonexistent on OSS/FS systems anyway.
-
Microsoft has had far more vulnerabilities than anyone else,
according to SecurityTracker.
The paper
SecurityTracker Statistics (March 2002) analyzes vulnerabilities
from April 2001 through March 2002.
They identified 1595 vulnerability reports, covering 1175 products from
700 vendors.
Their analysis found that Microsoft had more vulnerabilities
than anyone else (187, or 11.7% of all vulnerabilities), and more than
four times the next vendor.
The next largest were Sun (42, 2.6% of the total), HP (40, 2.5%),
and IBM (40, 2.5%).
Solely OSS/FS vendors did much better: the
Apache Software Foundation had 13 (0.8% of the total), and Red Hat had
10 (0.6% of the total).
It can be argued that Microsoft sells more kinds of software
than most other vendors, but this is nevertheless an astonishingly
large number of vulnerabilities.
The gap between Microsoft and everyone else widened during the second
half of the year, which is even scarier.
-
In late June 2004,
the U.S. Department of Homeland Security’s Computer Emergency Readiness Team
(CERT) recommended using browsers other than Microsoft Corp.’s
Internet Explorer (IE) for security reasons.
Microsoft had failed to
patch a critical vulnerability for 9 months, and IE was
being actively exploited in horrendous ways.
Customers then rushed to download Mozilla and Mozilla Firebird,
popular OSS/FS alternatives, to replace IE. This was a good idea, since
4 more serious IE vulnerabilities were soon admitted, and
the technologically savvy began to switch in droves to OSS/FS browsers.
The U.S. CERT warned that the Microsoft browser (IE)
cannot protect against vulnerabilities, and
there were dangerous active attacks exploiting them.
A team of crackers (supposedly Russia-based)
exploited Microsoft IE vulnerabilities by also exploiting other
vulnerabilities in Microsoft’s IIS.
The crackers broke into IIS sites and inserted malicious
code that IE users would download if they viewed an IIS site they’d
broken into.
The IE users who visited those sites (who
legitimately trusted these sites) would have their IE program exploited,
which then compromised their system.
As a result, many IE users had keystroke information stolen from them.
It’s hoped the purpose was to steal credit card numbers, though
passwords and other sensitive data could have been stolen too
(e.g., to drain people’s bank accounts or steal extremely private data).
By June 25, 2004, this active attack was publicly known, but
a fix to IE wasn’t available until July 2, 7 days later.
Even worse, ZDNet found that
Microsoft
had failed to fix this critical known IE vulnerability for
nearly nine months.
And even after a 9-month lead time, ComputerWorld learned that the patch
doesn’t address another closely related vulnerability.
Nine months is a shamefully long time;
2-30 days is the expected time by most security practitioners,
since every day a known exploit is unfixed is another day
that attackers can exploit it, and attackers often know and exploit
attacks that the vendor claims are secret.
This is long after Microsoft loudly announced (in 2002) that
it would pay much more attention to security; certainly in this case
users were left unprotected for a long time.
Even more tellingly, at the same time (June 28, 2004),
Microsoft’s Bill Gates told Australians that while
other operating system vendors took 90-100 days
to release a security patch, Microsoft had this time
“down to less than 48 hours.”
Gates assured attendees that the Internet Explorer attack was new,
but later analysis has shown otherwise.
Clearly Microsoft admits that long delays in security patches are a bad
thing, but it nevertheless still commits them.
The U.S. CERT took the
unusual step of noting that a useful solution would be to stop using IE
and use another program instead.
SANS made a
similar announcement, noting that one solution would be to stop using IE.
OSS/FS programs sometimes have vulnerabilities too, but
it’s rare that they last so long.
More importantly,
users of OSS/FS programs can always fund to have a repair created
and implemented quickly if it is important to them, and can have that
fix reviewed and shared with others worldwide.
Proprietary users have no such options; proprietary users
are completely dependent on the proprietary vendor for making any
emergency repairs, and for more reacting more responsibly than this.
Downloads of Mozilla and Mozilla’s Firefox
dramatically increased in late June 2004, presumably as a response
to this serious problem in IE.
Downloads of Mozilla and Firefox browsers hit an all-time high on July 1, 2004,
from the usual 100,000 or so downloads on a normal day to more than 200,000
in one day.
Mozilla argues that IE is in general less secure, in part because
Microsoft’s ActiveX technologies, IE’s tight
integration into the Microsoft operating system, and IE’s
weak default security settings make IE easier to exploit than its
competition.
Even the U.S. CERT
notes that IE includes many design decisions that make it an especially
easy web browser to exploit; and all of them are true for IE and
not problems for Firefox, except for the fact that both use
graphical user interfaces.
For example,
Semantic recommends that users
consider disabling ActiveX altogether (see page 65), because
of ActiveX’s problems.
In contrast, every change made to Mozilla applications is
first peer reviewed by at least two engineers
who are familiar with the code and overall architecture of the system
before the new code is allowed into the product.
The product then goes through automated tests and evaluations,
and then Mozilla users and the development community are invited
to review the impact of each change by downloading the test builds
that are produced two or three times a day.
All source code is available for review by anyone.
This problem was so significant that it was noted in many different
media and technology analysis sites.
USA
Today noted in 2004 that “Using Microsoft’s Internet Explorer Web
browser to surf the Internet has become a marked risk -- even with the
latest security patches installed.”
The New York Times noted in 2004 that concerns about Internet
Explorer’s security vulnerabilities have dented its market share, and that
the US CERT recommendation to consider
other browsers was an unusual step.
The Inquirer reported
that the “US Government warns against Internet Explorer”, noting that
the US Government’s tone essentially
pleaded for “users to stop using Microsoft’s Internet Explorer”.
Netcraft suggested that this may mean that the browser wars
will recommence.
Netcraft noted that one major difference is that this attack
was different because of its extreme gravity:
“victims of [these] attacks might conceivably lose their life savings.
Some people now perceive Internet Explorer and Internet Banking as
a potentially lethal cocktail that must not be mixed,
with insiders in the banking industry urging their families to
switch if not operating systems, then at least browsers,
while conversely some internet banking customers have adapted to
the threat by forgoing convenience and moving funds back
into accounts which require traditional telephone and fax instructions.”
Netcraft also noted that there is now
“a serious alternative to Internet Explorer available on Windows”
and that
“this [combination of loss of confidence and a viable alternative]
is an extremely dangerous situation for Microsoft.
The phishing threats and the growing professional chorus of disapproval
for Internet Explorer provide Windows users with very good reasons
to turn elsewhere, even if only temporarily.
But [OSS/FS] Firefox is so good that many will want to stay with it.
And once they have tasted the power and freedom of open source,
maybe they will be tempted to try ‘just one more program’.”
Indeed, the security problems of IE have caused
IE to lose marketshare, ceding
marketshare to OSS/FS browsers.
As if to prove the point of how differently security vulnerabilities are
handled, a vulnerability was found soon after that affected
Mozilla and Firefox when running on Windows (though it was actually
another Windows vulnerability).
In contrast with IE, the security fix
was delivered extremely rapidly.
The initial notice of this vulnerability was on July 7, it was
fixed the same day, and the configuration change was released to all
in one day - with no known compromises to any system.
The Mozilla project has
more information
about the security issue,
and you can even read the
detailed
discussions between the finders and developers.
What’s especially interesting is that it’s not even a vulnerability in
the OSS/FS programs; it’s a vulnerability in Windows itself.
The problem is the Windows maintains a registry of secure programs that
accept URLs, but the list provided by Microsoft includes
an application known to be insecure (the shell: URL).
Windows XP Service Pack 1 was supposed to have closed this hole,
but it didn’t.
Thus, the Mozilla project had to create a patch
to compensate for Windows’ insecurity, but
explicitly disabling it on Windows.
It appears
that other Microsoft products, such as MSN Messenger and Word,
are affected by this vulnerability in Windows.
And it appears that Mozilla is continuing to be proactive in its security;
they have
already added new features to make attacks against the
browser even more difficult.
After all that, on July 13, 2004,
Secunia reported
four more extremely critical vulnerabilities in IE.
The only solutions at the time were to disable active scripting or
use another product.
It’s unlikely that these additional vulnerabilities will improve
IE’s reputation.
All of this has convinced me;
in my
essay on how to secure Microsoft Windows (for home and small business users),
I suggest switching from IE to Firefox, and from Outlook to something
else; too many people
(both myself and others) have observed that simply replacing these
two programs greatly reduces the number of security problems in the
real world.
-
According to Symantec Corp.,
Mozilla Firefox fixed its vulnerabilities faster, and had fewer
severe vulnerabilities (though more total vulnerabilites),
in the July - December 2004 period than Internet Explorer.
Symantec Internet Security Threat Report, Volume VII (released
March 2005),
found that Internet Explorer had 9 highly severe vulnerabilities affecting it
in the time period, while Firefox had 7.
In addition, the Internet Explorer flaws also took longer to fix --
an average of 43 days, compared to 26 days for Mozilla browsers
(which presumably includes Firefox).
In all previous reports,
the total number of Mozilla vulnerabilies was lower than IE.
The bad news is that this March 2005 report
reports that in this period there were more total vulnerabilities
(though fewer high severity ones) in Mozilla-based browsers than in IE.
There are 13 vulnerabilities affecting Internet Explorer,
compared to 21 vulnerabilities affecting the Mozilla and Mozilla
Firefox browsers during the survey period.
It’s difficult to tease out what the issue is, unfortunately.
Symantec was encouraged that the security vulnerabilities,
where found in Firefox, were at least less likely to be of high severity.
The good (?) news is that attackers were only exploiting
the IE vulnerabilities, not the Mozilla/Firefox ones, in the time period.
-
According to a Network Security evaluation, an OSS/FS vulnerability
scanner (Nessus) was found to be the best (most effective).
On January 8, 2001,
Network Computing’s article
Vulnerability Assessment Scanners.
reported an evaluation of nine network scanning tools,
most of them proprietary.
In their evaluation, Network Computing set up demonstration
systems with 17 of the most common and
critical vulnerabilities; they then used
the various network scanning tools to see how effectively each
of the tools detected these vulnerabilities.
Sadly, not one product detected all vulnerabilities; the best scanner
was the OSS/FS program Nessus Security Scanner, which found 15 of the 17
(which also received their top total score); the next best was
a proprietary scanner which only found 13.5 out of 17.
In their words,
Some of us were a bit skeptical of the open-source Nessus
project’s thoroughness until [Nessus] discovered the greatest
number of vulnerabilities. That’s a hard fact to argue with,
and we are now eating our words ...
[Nessus] got the highest overall score
simply because it did more things right than the other products.
I agree with the authors that ideally a network vulnerability scanner
should find every well-known vulnerability,
and that “even one hole is too many.”
Still, perfection is rare in the real world.
More importantly,
a vulnerability scanner should only be part of the process to secure an
organization - it shouldn’t be the sole activity.
Still, this evaluation suggests that an organization
will be more secure, not less secure, by using an OSS/FS program.
It could be argued that this simply shows that this OSS/FS
program had more functionality - not more security - but in this case,
the product’s sole functionality was to improve security.
-
Information Systems Journal (a peer-reviewed journal) published
researcher Christian Payne’s results, showing good evidence that OSS/FS can
be secure.
Information Systems Journal, Vol.12, Issue 1, February 2002, includes
the peer-reviewed paper
“On the security of open source software” by
Christian Payne of Murdoch University (Perth, Australia).
In it, Payne first summarizes the various arguments made for and against
open source software.
He discusses some of the arguments that OSS/FS is more secure, in particular,
claims that the process of peer review improves security,
OSS/FS flexibility and freedom is a significant aid
(e.g., organizations are free to audit OSS/FS,
modify it to meet their security needs, and rapidly patch OSS/FS without
having to wait for a vendor),
and that OSS/FS projects tend to respond more quickly with security fixes.
He also discusses some of the arguments made against OSS/FS, such as
claims that
that vulnerabilities are harder for attackers
to find in proprietary programs (since the source code is not available),
and that there are flaws in the peer review argument
(e.g., it may be available but not necessarily reviewed).
In short, there are different effects, and it’s easy to have opinions
about the strengths of those different effects.
Without measurement, it’s hard to know what effects are stronger.
But Payne goes beyond a mere summary of arguments, and actually
works to try to gather quantitative data to measure the effect of these
alternative approaches.
Payne devised a scoring system for measuring security features,
measuring reported security vulnerabilities,
and then rolling those two factors into a final score.
He then applied this to two OSS/FS systems (Debian and OpenBSD) and one
proprietary system (Solaris, which at the time was proprietary);
all are Unix-based operating systems.
The following table summarizes the results:
| | Debian | Solaris | OpenBSD |
|---|
| Number of Features: | 15 | 11 | 18 |
|---|
| Features score: | 6.42 | 5.92 | 7.03 |
|---|
| Number of Vulnerabilities: | 12 | 21 | 5 |
|---|
| Vulnerabilities score: | 7.72 | 7.74 | 4.19 |
|---|
| Final Score: | -1.0 | -3.5 | 10.2 |
|---|
OpenBSD had the most security features (features that support confidentiality,
integrity, availability, or audit), with Debian second and Solaris third.
OpenBSD also had the highest score for those features.
In terms of vulnerabilities, OpenBSD had the fewest reported vulnerabilities,
and those vulnerabilities “were also relatively minor[,] only rating
an average of 4.19 out of 10”.
Solaris, the proprietary system, had the largest number of vulnerabilities.
The final rolled-up score is quite intriguing: of the three systems,
the proprietary system had the worst security by this rolled-up measure.
The author correctly notes that these are only a few systems, using information
taken at only one point in time, so these results are “far from being final”.
And the author certainly does not take the view that any OSS/FS program
is automatically more secure than any proprietary alternative.
Still, this data suggests that OSS/FS programs can be more secure
than their competing proprietary products.
Hiding the source code certainly did not reduce the number of
reported vulnerabilities, contrary to some proprietary vendors’ claims;
the proprietary system had the most vulnerabilities reported about it.
OpenBSD has far better score than either of the other systems;
the author believes this is because of OpenBSD’s focused code audits
by developers with the necessary background and security expertise.
A BZ Research survey of 6,344 software development managers shows Linux
superior to Windows for operating system security attacks, and OSS/FS
was in most categories considered equal or better at the application layer.
A BZ Research survey of 6,344 software development managers
reported in April 2005
asked about the security of different popular enterprise
operating environments; OSS/FS did very well.
Below are some of the results;
the margin of error for the
survey is 2.5 percentage points.
Among server operating systems, there was uniform agreement that both
Sun Solaris and Linux were much more secure than Microsoft’s Windows Server
against operating system related attacks.
When comparing Sun Solaris against Linux by this measure,
There was no consensus as to whether Sun Solaris or Linux were better against
operating system level attacks;
more people ranked Linux as “secure or very secure” compared to Sun Solaris,
yet more people also ranked Linux as “very insecure or insecure” than
Sun Solaris.
One complication (for this paper’s purpose) is that Sun Solaris was
originally built in large part from OSS/FS approaches, then made
proprietary for a time, and more recently released as OSS/FS, so it’s
difficult to cleanly take lessons from its Solaris results
for either OSS/FS or proprietary approaches.
| | MS Windows Server | Linux | Sun Solaris |
|---|
| Very insecure or Insecure: | 58% | 6% | 13% |
|---|
| Secure or very secure: | 38% | 74% | 66% |
|---|
Windows Server also did poorly against application-related “hacks and
exploits”:
| | MS Windows Server | Linux |
|---|
| Very insecure or Insecure: | 58% | 18% |
|---|
| Secure or very secure: | 30% | 66% |
|---|
OSS/FS was also far ahead of proprietary programs in
in 4 of the 8 categories they considered:
desktop/client operating systems (44% to 17%), Web servers
(43% to 14%), server operating systems (38% to 22%),
and components and libraries (34% to 18%).
Results were essentially equal in three categories:
desktop/client applications, server applications and application servers.
Only in one area was proprietary software considered more secure than
OSS/FS, database servers (34% to 21%).
Note that this is merely a survey of opinions.
Opinions can, of course, be quite wrong; measurements of products
are often better than measurements of opinions.
Still, opinion polls of large numbers of people who would have
every reason to know the facts should not be ignored.
Security is notoriously hard to measure, and many reports that
attempt to do so end up with interesting information that’s
hard to interpret or use.
And some reports come from sources whose reliability is widely questioned.
On November 2, 2004,
mi2g reported on successful
digital breaches against permanently connected computers worldwide.
They concluded that BSDs (which are usually OSS/FS) and Apple’s computers
had the fewest security breaches; on the
surface, that sounds positive for OSS/FS.
They also reported that GNU/Linux systems had the most breaches, followed by
Windows.
That result sounds mixed, but digging deeper it turns out that this
ranking is artificial, based on artificial definitions.
Their default definition for a security breach only included manual attacks
and ignored malware (viruses, worms, and Trojans).
Yet malware is one of the dominant security problems for Windows users,
and only Windows users!
After all, why bother with a manual attack when completely automated attacks
against broad collections of computers will do more?
When they include malware in their calculations for all system breaches,
“including the impact of MyDoom, NetSky, SoBig, Klez and Sasser,
Windows has become the most breached computing environment
in the world accounting for most of the productivity losses
associated with malware - virus, worm and trojan - proliferation.”
Even without malware, in governments
“the most breached Operating System for online systems has
now become Windows (57.74%) followed by Linux (31.76%)
and then BSD and Mac OS X together (1.74%)” (a reversal of their
previous rankings).
But while these results are interesting,
there are significant problems in interpreting
what these results actually mean:
- Ignoring malware in the main report is hard to justify, though to be
fair the report does clearly state this assumption and
explains how the results would change with a different definition.
But most users want to be protected from
all attacks, automated or not, and it’s especially hard to
justify this assumption
since malware is a leading attack on only one of the systems.
- None of these statistics, at least what’s publicly posted, seem to take
market share into account, or control sampling in general.
If 2 of 100 type A machines are broken into, and 1 of 1 type B machines are
broken into, type A may have twice as many break-ins, but that’s irrelevant
to most users; what’s more interesting is noticing that
98% of the type A machines were unbreached, while
0% of the type B machines were unbreached!
Besides, what you really want to know is not raw numbers like this, but the
probability that a given system will be breached (given various
criteria such security configuration and as if you’re relatively
up-to-date on patches).
That information
doesn’t appear to be available from the public information provided.
Checking the source (mi2g) yields decidedly mixed reports, too.
mi2g clearly states that it has no financial interest in Apple.
I always search for financial links in research
reports, and that’s a good sign at least.
However,
The Register,
the full disclosure mailing list,
attrition.org,
Vmyths,
and
Yahoo! News
provide a number of troubling reports about the quality and validity
of mi2g’s reports.
Many of these reports suggest that these figures are made up, and cannot be
relied on at all.
Hopefully in the future I can gain a better understanding of the
situation; I know nothing more than what I reference above.
But for now,
I’m mentioning both sides (mi2g’s results and the concerns many
number of people have raised about them),
so that those who have heard about these results
will know about the controversies and limitations surrounding this data.
I’m not including mi2g results in my major list of studies, given the
limitations and current questions surrounding them.
One serious problem in making secure software
is that there are strong economic disincentives
for proprietary vendors to make their software secure.
For example, if vendors make their software more secure,
they would often fail to be “first” in a given market;
this often means that they will lose that market.
Since it is extremely difficult for customers to distinguish
proprietary software with strong security from those with poor security,
the poor products tend to eliminate the good ones (after all, they’re
cheaper to develop and thus cost less).
Governments have other disincentives as well.
For a discussion of some of the economic disincentives for secure software, see
Why Information Security is Hard - an Economic Perspective by
Ross Anderson (Proceedings of the
Annual Computer Security Applications Conference (ACSAC),
December 2001, pp. 358-365).
It’s not clear that OSS/FS always avoids these disincentives, but
it appears in at least some cases it does.
For example, OSS/FS source code is public, so the difference in security
is far more visible than in proprietary products.
One of the most dangerous security problems with proprietary software
is that if intentionally malicious code is snuck into it,
such code is extremely difficult to find.
Few proprietary vendors have other developers
examine all code in great detail -
their testing processes are designed to catch mistakes (not malice)
and often don’t look at the code at all.
In contrast, malicious code can be found by anyone when the source code
is publicly available, and with OSS/FS, there are incentives for arbitrary
people to review it (such as to add new features or perform a security review
of a product they intend to use).
Thus, someone inserting malicious code to an OSS/FS project
runs a far greater risk of detection.
Here are two examples, one confirmed, one not confirmed:
-
Some time between 1992 and 1994,
Borland inserted an intentional “back door” into their database server,
“InterBase”, as a secret username and fixed password.
This back door allowed any local or remote user
to manipulate any database object and install arbitrary programs,
and in some cases could lead to controlling the machine as “root”.
This vulnerability stayed in the product for at least 6 years - no
one else could review the product,
and Borland had no incentive to remove the vulnerability.
Then Borland released its source code on July 2000 as an OSS/FS project.
The “Firebird” project began working with the source code,
and uncovered this serious security problem with InterBase in
December 2000 (only 5 months after release).
By January 2001 the CERT announced the existence of this back door
as CERT advisory CA-2001-01.
What’s discouraging is that the backdoor can be easily found
simply by looking at an ASCII dump of the program (a common cracker trick),
so it’s quite possible that this vulnerability was exploited many times
in the intervening years.
Once this problem was found by open source developers reviewing the code,
it was patched quickly.
-
Mohammad Afroze Abdul Razzak,
arrested by Mumbai (Bombay) police Oct. 2, 2001, claims that
Osama bin Laden’s Al Qaeda network were able to gain employment
at Microsoft and attempted to plant
“trojans, trapdoors, and bugs in Windows XP.”
This was reported to Ravi Visvesvaraya Prasad,
a New Delhi information systems and telecommunication consultant,
and then reported by the
Washington Post’s Newsbytes division.
This claim has not been confirmed; indeed, I’m somewhat skeptical.
The problem, however, is that this is impossible to disprove.
Even if this particular case isn’t true, note that this threat
is unfortunately a credible threat to proprietary software, because
very few of its users can review the code.
This is far less dangerous to OSS/FS software, due to the
worldwide review that’s possible (including the ability to see
the changes made in each version).
Bruce Perens, in “Open sourcers wear the white hats”,
makes the interesting claim that most of the people reviewing
proprietary products looking for security flaws
(aside from one or two paid reviewers) are “black hats,”
outsiders who disassemble the code or try
various types of invalid input in search of a flaw that they can exploit
(and not report).
There is simply little incentive, and many roadblocks,
for someone to search for security flaws simply to improve someone else’s
proprietary product.
“Only a black hat would disassemble code to look for security flaws.
You won’t get any ‘white hats’ doing this
for the purpose of [just] closing the flaws.”
In contrast, he thinks many open source developers do have
such an incentive.
This article slightly overstates the case;
there are other incentives (such as fame) that can motivate a few people
to review some other company’s proprietary product for security.
Still, it has a point;
even formal reviews often only look at designs (not code),
proprietary code is often either unreviewed or poorly reviewed,
and there are many cases (including the entire OpenBSD system) where
legions of developers review open source code for security issues.
As he notes,
“open source has a lot of ‘white hats’ looking at the source.
They often do find security bugs while working on
other aspects of the code, and the bugs are reported and closed.”
OSS/FS programs can be evaluated using the formal security evaluations
required by some government agencies,
such as the Common Criteria (ISO Standard 15408) and NIST FIPS 140,
One complication has been that many governments have assumed
that vendors would pay for such evaluations on their own.
This assumption is a poor match for many OSS/FS projects, whose
business models typically require that users who want a particular improvement
(such as an evaluation) pay for that improvement (in money or effort).
This doesn’t make formal security evaluations of OSS/FS projects impossible,
but it may require that customers change their approach
to performing evaluations in some cases.
In particular, customers will need to not assume that vendors
will do evaluations ‘for free.’
Part of the problem is that many organizations’
acquisition strategies were defined before OSS/FS became prevalent,
and have not yet been adjusted to the widespread presence of OSS/FS.
Some OSS/FS programs have multiple project sites, so an organization
must select exactly what project to evaluate, but that‘s
not really change; evaluations of proprietary
programs must select a specific version too.
Here are several reports on OSS/FS program evaluations:
-
Government Computer News reports that
Novell Inc.’s SUSE Linux Enterprise Server 9 has achieved
Controlled Access Protection Profile (CAPP) with EAL 4+
when running on IBM Corp.’s eServers.
The U.S. NIAP
Validated Products List shows that
Novell’s SuSE Linux Enterprise Server V8 successfully passed a
Common Criteria EAL3+ evaluation against the
Controlled Access Protection Profile (CAPP) in January 2004.
-
Red Hat Enterprise Linux 3 passed an EAL2 evaluation in February 2004.
Various reports in
IT Security
and by
Red Hat
state that in August 2004 Red Hat Enterprise Linux 3 was successfully
against the Common Criteria EAL 3+
and the Controlled Access Protection Profile (though it hasn’t
appeared in the Validated Products List yet).
Red Hat
also reports that they are working to complete an EAL 4 evaluation
(in various forums).
-
Mandrakesoft (now Mandriva)
and others have won a 1 million Euro three-year contract to help
create a highly secure Linux based solution for
the French Ministry of Defense that meets
Common Criteria Evaluation Assurance Level (EAL) 5.
-
Trusted Computer Solutions Inc. of Herndon, Va.,
expects to begin beta-testing Trusted Linux this fall and
seek Common Criteria certification at EAL 4
to meet not only the
Controlled Access Protection Profile (CAPP), but the additional requirements
of the Labeled Security Protection Profile, the
Role-based Access Control Protection Profile, and
the requirements of Director of Central Intelligence Directive 6/3.
-
The IBM
Crypto for C (ICC) library received a FIPS 140-2 level 1 certificate #384
in 2004, and it uses the cryptographic library provided by OSS/FS OpenSSL.
-
The OSS/FS cryptographic library OpenSSL is being
evaluated itself using the FIPS 140 evaluation process.
The OpenSSL FAQ
provides more information on an effort to evaluate OpenSSL sponsored by
HP and the Defense Medical Logistics Standard Support program.
Some other interesting data about security can be found in
Google
Facts/Statistics question about computer security and loss of data.
The “Alexis de Tocqueville Institute” (ADTI)
published a white paper called
“Opening the Open Source Debate” that
purported to examine OSS/FS issues.
Unfortunately, ADTI makes many wrong, specious,
and poorly-argued claims about OSS/FS, including some related to security.
Wired (in its article
Did MS Pay
for Open-Source Scare?) made some startling discoveries about ADTI;
after querying, they found that
“a Microsoft spokesman confirmed that Microsoft provides
funding to the Alexis de Tocqueville Institution...
Microsoft did not respond to requests for comment on
whether the company directly sponsored the debate paper.
De Tocqueville Institute president Ken Brown and
chairman Gregory Fossedal refused to comment on
whether Microsoft sponsored the report.”
Politech found additional
suspicious information about ADTI, and
UPI
reported that ADTI
receives a significant portion of its funding from the Microsoft Corp,
and thus it essentially lobbies in favor of issues important to Microsoft.
ADTI apparently has a history of creating “independent” results that
are apparently paid for by corporations (e.g., see the
Smoke
Free for Health article about ADTI’s pro-tobacco-lobby papers).
Reputable authors clearly identify any potential conflict of interest,
even if it’s incidental; ADTI did not.
The ADTI paper makes many errors and draws unwarranted conclusions.
I’ll just note a few examples of the paper’s problems that aren’t
as widely noted elsewhere:
incorrect or incomplete quotations,
rewriting web browser history, and cleverly omitting the most important
data in one of their charts:
-
The ADTI “quotes” me several times in the paper, but
in some cases claims I said something I never said, and in others places
them out of context by intentionally omitting important things that I said.
ADTI originally claimed that I said that
“without licensing the source code in a multilicense
format, (referring to other more permissive licenses),
it is impossible for GPL to work for a proprietary business model.”
But I never said this.
In fact, I specifically noted to ADTI that
Microsoft
sells a GPL’ed product (a fact I’d already publicly published).
Instead of removing the statement, ADTI later made up a statement and claimed
that I said it.
What I really said was more nuanced:
“without licensing the source code in a
multilicense format [GPL and other licenses],
the GPL does not permit certain kinds of uses in
proprietary business models.”
The words are similar, but this is a much narrower statement.
In particular, ADTI’s Brown was essentially trying to claim that the
GPL was essentially incompatible with business,
even though this wasn’t true, I told them it wasn’t true, and even
provided them with examples.
ADTI also claims I said that
“today I would be confident that the number [of GPL software]
has probably grown to 80%;”
I only said that I believed the number was probably larger than 50%,
but since I
couldn’t remember the exact figures offhand, I told them to
examine my papers - a trivial search which ADTI did not do
(if they had, they’d notice that I’d recently published that
71.85% of
Freshmeat’s software packages were covered by the GPL).
More intriguing are the omissions.
For example, I explained to ADTI the GPL license (which they did not
understand, even though they were attacking it); ADTI seems to think
that the GPL requires public release of code, but it does not.
The GPL only
requires that those who receive the binary executable receive the source code.
This is crucial, because it means you can still keep “secrets”
in GPL’ed code, in spite of ADTI’s implied assertion otherwise.
Besides, there’s anecdotal evidence that the government uses most GPL’ed code
as-is, in which case these issues don’t apply - the GPL permits
arbitrary use and redistribution of unmodified copies.
-
For a second example,
the ADTI paper rewrites the history of web browsers in an attempt to
make its claims; it bases
much on the claim that Mosaic was an open source web browser, but
it never was; modified versions of
the Unix version could only be used non-commercially without a separate license
(OSS/FS must be usable commercially), and the Mac and Windows licenses
were even more restrictive.
It also completely omits the heavily publicized move of Netscape to OSS/FS
in 1998, clearly the most important event in web browser history
relating to OSS/FS.
I specifically mentioned these problems to ADTI before they published
their paper, but ADTI was not willing to fix their paper to
meet the facts.
-
Switching to the third example,
ADTI includes a chart of showing source lines of code (SLOC) for various
programs; it even references my paper
More than a Gigabuck
while noting that the Linux kernel is over 2 million SLOC.
The same chart also reports that Windows XP is 30 million SLOC,
an interesting statement since to my knowledge this value has not
been made public (ADTI has not revealed their source, but has
confirmed to me that they really meant Windows XP).
But note the invalid comparison - ADTI reports on the
Linux kernel (a small part of an OS),
and Windows XP (a whole OS), but not on
an whole OSS/FS OS.
ADTI willfully ignores my paper’s abstract and main point, which reported that
the whole Red Hat Linux 7.1 distribution is also 30 million SLOC;
by omitting the most important data, ADTI gives false impressions.
But these are merely the tip of the iceberg; the paper’s flaws are
so numerous, and discussing the flaws in its conclusions require so much
effort, that a serious rebuttal would require writing a whole separate paper.
Thus, I recommend that anyone who reads the ADTI paper also examine
the detailed rebuttals available from many different sources, since these
rebuttals expose the paper’s numerous flaws.
Rebuttals are available from
John Viega and
Bob Fleck of Secure Software (Viega is a respected security expert),
Juliao Duartenn
(Director of the Security Skill Center, Oblog Software, SA),
Roaring Penguin’s David Skoll (via the Register),
Ken Ambrose (via LWN), and
Leon Brooks.
Anthony Awtrey analyzed the changes made
in the published editions of the ADTI paper.
Operating system expert
Andrew Tanenbaum
responded to ADTI’s later claim that Torvalds stole Linux, and
found that ADTI’s Ken Brown
“doesn’t have a clue what he is talking about,”
was “confused about patents, copyrights, and trademarks,”
failed to even do basic research (he failed to consider original sources
and didn’t bother to read the major works on his subjects),
and wrote “patent nonsense.”
In short, ADTI’s paper is a highly biased and poorly researched “report.”
All of this is unfortunate, because the real Alexis de Tocqueville
strongly approved of the OSS/FS’s underlying approaches.
Alexis de Tocqueville remarked on the extraordinary success
in the United States of voluntary community associations to
do many tasks, and viewed them extremely favorably.
He found such associations to be remarkably effective.
There are other non-quantitative discussions on OSS/FS and security.
The October 2002 paper
Open Source Digital Forensics Tools: The Legal Argument
by Brian Carrier
notes that to enter scientific evidence into a United States court,
a forensics tool must be reliable and relevant as determined through the
“Daubert” guidelines.
The paper examines then those guidelines and argues that
“open source tools may more clearly and comprehensively meet
the [forensics] guidelines than closed source tools.”
Stacey Quandt’s
”Linux and Windows security compared” compares Windows and GNU/Linux
security qualitatively; she concludes that
they’re comparable in network security/protocols,
deployment and operations, and trusted computing;
Linux is superior in base security, application security, and
open standards.
The only area where Windows was ahead was in assurance, because
an EAL4 Common Criteria evaluation has been completed for
Windows; an EAL3 evaluation for a GNU/Linux has completed,
but an EAL4 evaluation for a GNU/Linux is in process but not yet complete.
Since an EAL4 GNU/Linux evaluation is expected to
complete by around the end of 2004, this doesn’t appear to be
a long-lasting advantage for Windows.
Many security experts have stated that OSS/FS has advantages over
the security of proprietary software, including
Whitfield Diffie
(co-inventor of public key cryptography),
Bruce Schneier (expert on cryptography and computer security),
Vincent Rijmen (a developer of the Advanced Encryption Standard (AES)),
Elias Levy (Aleph1, the former moderator of the
popular security discussion group Bugtraq).
John Viega (author of a book on secure programming), and
Peter Neumann.
A humorous article expressing this view is the article
Microsoft Windows: A lower Total Cost of 0wnership
(0wnership starts with zero, not the letter O; 0wn is
slang for gaining illicit remote administrative control over someone
else’s computer).
This article by Immunix, Inc., compares the security of
Microsoft Windows and OSS systems based on their technology characteristics,
and declares that the “best platform for your targets [victims]
to be running is Microsoft Windows, allowing you unparalleled
value for their dollar”
(see the next section for the more traditional
Total Cost of Ownership information).
This doesn’t guarantee that a particular OSS/FS program is more secure
than a particular proprietary product - merely that there are
some fundamental security advantages to easing public review.
In contrast,
Microsoft’s Jim Allchin disclosed under oath in court testimony that
some Microsoft code was so flawed it could not be safely disclosed
to the public.
Yet more recently, Microsoft announced its
“Government Security Program” to allow governments to view most
source code (though not all code, and they cannot change and freely
redistribute the results).
Indeed, Reuters reported a survey by Forrester Research Inc. that found that
most computer security experts at major companies
do not think Microsoft Corporation’s products are secure;
77% said security was a top concern when using Windows.
The primary problem reported was that patches were not implemented, because
“administrators lacked both the confidence that a patch won’t bring
down a production system and the tools and time to
validate Microsoft’s avalanche of patches.”
If you need to secure Windows, feel free to look at my essay on
how to secure Microsoft Windows (for home and small business users);
while many issues are true for any system, there are also a number of
security problems that are essentially unique to Windows.
Now it should be obvious from these figures that OSS/FS systems
are not magically invincible from security flaws.
Indeed, some have argued that making the source code available gives
attackers an advantage (because they have more information to make an
attack).
While OSS/FS gives attackers more information, this
ignores opposing forces: having the source code
also gives the defenders more information (because they can also
examine its original source code), and in addition, the defenders can
improve the code.
More importantly, the necessary information for breaking into a program
is in the binary executable of the program; disassemblers and decompilers
can quickly extract whatever information is needed from executables to
break into a program, so hiding the source code isn’t all that helpful
for preventing attacks against attackers who are willing to use
such programs.
Even if source code were required (it’s not), source code can often
be acquired by attackers, either by simply asking for it
(in exchange for funds) or by
acquiring the source code itself by attack.
Again,
it is not true that proprietary programs are always more secure, or
that OSS/FS is always more secure, because there are many factors at work.
Writing secure software does require that developers know
how to do it, but there’s no evidence that proprietary software developers
in general have more such knowledge; indeed, since many developers
create both proprietary and OSS/FS programs, it’s unlikely there’s a major
difference, and OSS/FS encourages code review in a way that few
proprietary projects match.
It is also greatly enhanced by review;
certainly not all OSS/FS programs are reviewed for security, but many are,
both by other developers and by others
(for example,
one group of students was assigned the task of finding and reporting
vulnerabilities, and reported 44).
And clearly, any vulnerabilities must be fixed and distributed.
Note that a well-configured and well-maintained system, of any kind, will
almost always be far more secure than a poorly configured and
unmaintained system of any kind over the long term.
For a longer description of these issues, see
my discussion on open source and security
(part of my book on
writing secure software).
However, from these figures, it appears that OSS/FS systems are in
many cases
better - not just equal - in their resistance to attacks as
compared to proprietary software.
Total cost of ownership (TCO) is an important measure;
it doesn’t matter if a product starts out cheaply if it costs you more
down the line.
However, TCO is extremely sensitive to the set of assumptions you make.
Indeed, whatever product you use or support, you can probably find a
study to show it has the lowest TCO for some circumstance.
Not surprisingly, both
Microsoft and
Sun
provide studies showing that their products have the lowest TCO.
Xephon has a study
determining that mainframes are the cheapest per-user
(due to centralized control) at £3450 per user per year;
Centralized Unix cost £7350 per user per year, and a
decentralized PC environment costs £10850 per user per year.
Xephon appears to be a
mainframe-based consultancy, though,
and would want the results to come out this way.
There are indeed situations where applying a mainframe makes sense..
but as we’ll see in a moment, you can use OSS/FS in such environments too.
In short, what has a smaller TCO depends on your needs and your environment.
First, identify what the requirements are, including the types of
applications.
You must then determine the architectural options that meet these requirements.
For example, GNU/Linux systems can be implemented as independent client
systems with a few common servers, just like most Windows systems are.
But there are many architectural alternatives, such as using
X-Windows terminals (programs run on a central server (so the client systems
can be extremely low-end “throw-away” systems), clustering
(where tasks can be divided among many computers), or use
Stateless
Linux (programs run locally on the computer, but since nothing is
stored locally, anyone can log into any computer later).
Then, to determine TCO you must identify all the important cost drivers
(the “cost model”) and estimate their costs.
Don’t forget “hidden” costs, such as administration costs, upgrade costs,
technical support, end-user operation costs, and so on.
Computer Sciences Corporation’ study “Open Source: Open for Business”
(pp. 39-43) identifies the TCO factors that it believes are most
important for evaluating OSS/FS with proprietary software:
hardware costs (including purchase price
and hardware maintenance), direct software costs (including purchase price
and support and maintenance), indirect software costs
(especially administration of licenses),
staffing costs, support costs, and downtime
(CSC claims that the “modularity of Linux can allow a very lean
build to be deployed, which in turn can enable more stability...”).
To be honest, the term “TCO” is common but misleading for most software,
especially for proprietary software, because software users often
don’t own the software they use and thus don’t have the rights of ownership.
It might be more accurate to say that proprietary software users often
“lease” or “rent” the software,
and thus this category could more accurately be named
“total cost to lease or own”.
Fundamentally,
unless you arrange to have a software program’s copyright transferred to you,
you do not actually own the software --
you only own a license to run the software in certain
limited ways.
That’s an important distinction; in particular, with proprietary software
you typically do not have the rights associated with ownership.
When you pay to own
a physical product (say a building or computer hardware), you typically
have nearly unlimited rights to modify and resell the product you bought
(subject to legal limits that prevent harm to others like zoning laws and
limits on electromagentic emissions).
In contrast, with nearly all proprietary software, you do not
have the right to modify the software to suit your needs.
Many proprietary licenses are even more stringent; they typically
forbid reverse engineering the product to understand
what it does (say, to examine its security), forbid publishing benchmarks
or reviews without approval by the vendor, and
often forbid (sub)leasing, reselling, or redistributing the product.
These kinds of limits make proprietary software users
more like leasee or a renter of a building,
who can occupy a space but cannot modify or sublease the space.
Some proprietary software programs are sold for use only over a period of
time, and thus the analogy to renting is especially easy to see.
But though there are many proprietary software programs that
are sold with a one-time cost (a “perpetual” license),
in reality these programs also impose recurring fees,
such as upgrade costs to continue to use the programs
on newer hardware and operating systems, upgrades so that your software
will continue to be compatible with others’ copies and with other
software, and varous support fees, and so
even so-called perpetual licenses have
recurring costs like a typical rent or lease.
This isn’t necessarily terrible, and I’m certainly not going to
say that such arrangements are unethical;
people decide to rent or lease physical property too!
But it’s important to understand what the transaction entails.
For more on this topic, see
Dr. Debora Halbert’s
The Open Source Alternative: Shrink-Wrap, Open Source and Copyright,
particularly point 22.
As explained by
Ross Anderson’s Trusted Computing (TC) Frequently Asked Questions (FAQ),
vendors are already working to build mechanisms to enforce this even
more strongly, because so-called “trusted computing” transfers control of
your computer from you to the vendors
(the FSF calls this technology “treacherous computing” because while the
computer is more trustworthy for users, it does this by becoming
less trustworthy by owners).
As Anderson says,
“TC will also make it easier for people to rent software rather than
buy it; and if you stop paying the rent, then not only does
the software stop working but so may the files it created.
So if you stop paying for upgrades to Media Player, you may lose
access to all the songs you bought using it.”
Users of OSS/FS software aren’t actually owners either, and they
have some of the same types of recurring costs (such as support).
On the other hand, the rights OSS/FS users are granted
(users can understand, publicly comment on,
modify, and redistribute the software -- and all this in perpetuity)
are far closer to an owner’s rights than
the rights granted to a proprietary software user.
OSS/FS has many strong cost advantages in various
categories that, in many cases, will result in its having the smallest TCO:
- OSS/FS costs less to initially acquire.
OSS/FS costs much less to get initially.
OSS/FS isn’t free in the monetary sense, because
the “free” in “free software” refers to freedom,
not price.
This distinction is usually summarized
as “free speech, not free beer”.
Merrill Lynch executive Robert Lefkowitz
found what may be a better way to describe it:
“We like to think of it as ‘free as in market.’”
OSS/FS isn’t cost-free, because
you’ll still spend money for paper documentation, support, training,
system administration, and so on, just as you do with proprietary systems.
In many cases, the actual programs in OSS/FS distributions
can be acquired freely by downloading them
(linux.org provides some
pointers on how to get distributions).
However, most people (especially beginners and those without high-speed
Internet connections)
will want to pay a small fee to a distributor for
a nicely integrated package with CD-ROMs, paper documentation, and support.
Even so, OSS/FS costs far less to acquire.
For example, examine the price differences when trying
to configure a server, such as public web server or an intranet
file and email server, in which you’d like to use C++ and an RDBMS.
This is simply an example; different missions would involve different
components.
Using the prices from “Global Computing Supplies” (Suwanee, GA),
September 2000, rounded to the nearest dollar,
here is a quick summary of the purchasing costs:
| | Microsoft Windows 2000 | Red Hat Linux |
| Operating System | $1510 (25 client) | $29 (standard), $76 deluxe, $156 professional (all unlimited) |
| Email Server | $1300 (10 client) | included (unlimited) |
| RDBMS Server | $2100 (10 CALs) | included (unlimited) |
| C++ Development | $500 | included |
Basically,
Microsoft Windows 2000 (25 client) costs $1510;
their email server Microsoft Exchange (10-client access) costs $1300,
their RDBMS server SQL Server 2000 costs $2100 (with 10 CALs),
and their C++ development suite Visual C++ 6.0 costs $500.
Red Hat Linux 6.2 (a widely-used GNU/Linux distribution) costs
$29 for standard (90 days email-based installation support),
$76 for deluxe (above plus 30 days telephone installation support), or
$156 for professional (above plus SSL support for encrypting web traffic);
in all cases it includes all of these functionalities
(web server, email server, database server, C++, and much more).
A public web server with Windows 2000 and an RDBMS might cost
$3610 ($1510+$2100) vs. Red Hat Linux’s $156,
while an intranet server with Windows 2000 and an email server
might cost $2810 ($1510+$1300) vs. Red Hat Linux’s $76.
Both packages have functionality the other doesn’t have.
The GNU/Linux system always comes with an unlimited number of licenses;
the number of clients you’ll actually use depends on your requirements.
However, this certainly shows that no matter what,
Microsoft’s server products cost thousands of dollars more
per server than the equivalent GNU/Linux system.
For another in-depth analysis comparing the initial costs
GNU/Linux with Windows, see
Linux vs. Windows: The Bottom Line
by Cybersource Pty Ltd.
Here’s a summary of their analysis (in 2001 U.S. dollars):
| | Microsoft Solution | OSS/FS (GNU/Linux) Solution | Savings by using GNU/Linux |
| Company A (50 users) | $69,987 | $80 | $69,907 |
| Company B (100 users) | $136,734 | $80 | $136,654 |
| Company C (250 users) | $282,974 | $80 | $282,894 |
Consulting Times
found that as the number of mailboxes got large, the three-year TCO
for mainframes with GNU/Linux became in many cases quite compelling.
For 50,000 mailboxes, an Exchange/Intel
solution cost $5.4 million, while the Linux/IBM(G6)
solution cost $3.3 million.
For 5,000 mailboxes, Exchange/Intel cost $1.6 million, while
Groupware on IFL cost $362,890.
For yet another study, see the
Cost Comparison from jimmo.com.
Obviously, the price difference depends on exactly what functions you need
for a given task, but for many common situations, GNU/Linux costs
far less to acquire.
-
Upgrade/maintenance costs are typically far less.
Long-term upgrade costs are far less for OSS/FS systems.
For example, upgrading a Microsoft system will typically cost around half the
original purchase.
What’s worse, you are essentially at their mercy for long-term pricing,
because there is only one supplier
(see Microsoft
Turns the Screws).
In contrast, the GNU/Linux systems can be downloaded (free), or simply
re-purchased (generally for less than $100), and the single upgrade
be used on every system.
This doesn’t include technical support, but the technical support can
be competed (a situation that’s not practical for proprietary software).
An anti-trust lawyer would say that OSS/FS technical support is “contestable.”
In short,
if you don’t like your GNU/Linux supplier (e.g., they’ve become too
costly), you can switch.
-
OSS/FS does not impose license management costs, does not in
practice include noxious licensing clauses, and avoids nearly all
licensing litigation risks.
Proprietary vendors make money from the sale of licenses, and are
imposing increasingly complex mechanisms on consumers to
manage these licenses.
Customers who cannot later prove than they paid for every installed copy
of proprietary software
(e.g., due to copying by an employee or losing the license paperwork)
risk stiff penalties.
In short: by using proprietary software, you run the risk of having
the vendor sue you.
To counter these risks, organizations must keep careful track
of license purchases.
This means that organizations must impose strict software license
tracking processes, purchase costly tracking programs, and pay for
people to keep track of these licenses and perform occasional audits.
Organizations must also be careful to obey licensing terms, some of which
may be extremely noxious or risky to the user.
Those who think that proprietary software gives them “someone to sue”
are in for a rude awakening -- practically all software licenses specifically
forbid it.
A Groklaw article contrasted the terms of the GPL vs. the
Windows XP End-User License Agreement (EULA) terms,
and stated that Windows XP’s license was far more dangerous to users.
For example, it requires a mandatory activation (where you reveal yourself
to the vendor), it allows the vendor to modify your computer’s software
at will, the vendor may collect personal data about you without
warning or limitation,
and the vendor can terminate the agreement without due process.
Con Zymaris has published a detailed comparison of the GPL
and the Microsoft EULA.
Both note, for example, that if things go awry, you can get no more than $5
from the Microsoft EULA.
Indeed,
many common EULAs now include
dangerous clauses.
In contrast, there’s no license management or litigation risk
in simply using OSS/FS software.
Some OSS/FS software do have legal requirements if you modify the program
or embed the program in other programs,
but proprietary software usually forbids modifying the program
and often also imposes licensing requirements for embedding a program
(e.g., royalty payments).
Thus, software developers must examine
what components they’re employing
to understand their ramifications,
but this would be true for both OSS/FS and proprietary programs.
See the licensing litigation discussion
later in this paper for more about licensing costs and risks.
- OSS/FS can often use older hardware more efficiently than
proprietary systems, yielding
smaller hardware costs and sometimes eliminating the need for new
hardware.
OSS/FS runs faster on faster hardware, of course, but many OSS/FS
programs can use older hardware more efficiently than proprietary systems,
resulting in lower hardware costs - and in some cases requiring no new costs
(because “discarded” systems can suddenly be used again).
For example, the
minimum requirements for Microsoft Windows 2000 Server
(according to Microsoft) are a Pentium-compatible CPU (133 MHz or higher),
128 MiB of RAM minimum (with 256MiB the “recommended minimum”), and a
2 GB hard drive with at least 1.0 GB free.
According to Red Hat,
Red Hat Linux 7.1 (a common distribution of GNU/Linux) requires at a minimum
an i486 (Pentium-class recommended), 32MiB RAM (64MiB recommended), and
650MB hard disk space (1.2 GB recommended).
In Scientific American’s August 2001 issue, the article
The Do-It-Yourself Supercomputer discusses how the researchers built a
powerful computing platform with many discarded computers and GNU/Linux.
The result was dubbed the “Stone Soupercomputer”; by May 2001 it
contained 133 nodes, with a theoretical peak performance of 1.2 gigaflops.
-
When used as an application server based system, the total costs
for hardware drop by orders of magnitude.
Many people make the mistake of deploying OSS/FS workstations (such
as GNU/Linux or the *BSDs) the same way they would deploy Windows systems.
Although it’s possible, this is an unnecessarily costly approach
if they’re installing a set of workstations
for typical productivity applications (e.g., word processing, spreadsheets,
etc. for an office),
For many, a better approach is to provide each user
with a very old GNU/Linux-based machine
which is merely a graphics display (an “X terminal”),
and then run the actual applications on an “application server”
that is shared by all the users.
See
How to create a Linux-based network of computers for peanuts for
more information about this.
With this application server approach, workstations can cost about $30 each
(using “obsolete” machines), a server (shared by many users) can cost
about $1000 each, and nearly all system administration is centralized
(reducing administration costs).
A nice side-effect of this approach is that
users can use any workstation just by logging in.
A more detailed discussion of this approach is given in
Paul Murphy’s article, Total cost of ownership series revisited.
Linux Style: Windows PCs vs. X Terminals: A Cost Comparison
describes how the Mark O. Hatfield Library at Willamette University
has used networked X terminals in its public and staff computing
environments since 1995.
The 15-year cost of 25 Linux systems in this environment
is estimated to be $41,359 versus a 15-year cost of $100,000 to $155,000
for Windows PCs serving the same function.
This is how the City of Largo, Florida,
and many other organizations use GNU/Linux.
-
As the number of systems and hardware performance increases,
this difference in initial and upgrade costs becomes even more substantial.
As the number of servers increases, proprietary solutions become
increasingly costly.
First, many proprietary systems (including Microsoft) sell per-client
licenses; this means that even if your hardware can support more clients,
you’ll must pay more to actually use the hardware you’ve purchased.
Secondly, if you want to use more computers, you must pay for more
licenses in proprietary systems.
In contrast,
for most GNU/Linux distributions, you can install as many copies as you like
for no additional fee, and there’s no performance limit built
into the software.
There may be a fee for additional support, but
you can go to competing vendors for this support.
According to
Network World Fusion News, Linux is increasingly being
used in healthcare, finance, banking, and retail due to its
cost advantages when large numbers of identical sites and servers are built.
According to their calculations
for a 2,000 site deployment, SCO UnixWare would cost $9 million,
Windows would cost $8 million, and Red Hat Linux costs $180.
- There are many other factors; their effect varies on what
you’re trying to do.
There are many other factors in TCO, but it’s difficult to categorize their
effects in general, and it’s generally difficult to find justifiable
numbers for these other effects.
Windows advocates claim that system administrators are cheaper and
easier to find than Unix/Linux administrators, while GNU/Linux and Unix
advocates argue that fewer such administrators are needed
(because administration is easier to automate and the systems are
more reliable to start with).
Various reports have mentioned this
(a Red Hat executive
stated that one Wall Street bank has one administrator for 800 machines),
quantitative studies are beginning to back this claim that fewer
administrators are needed.
Some GNU/Linux advocates have told me that GNU/Linux lends itself to hosting
multiple services on one server in cases where Windows installations
must use multiple servers.
License compliance administration can be costly for proprietary systems
(e.g., time spent by staff to purchase CALS, keep track of licenses,
and undergo audits) - a cost that simply isn’t relevant to OSS/FS.
- Cybersource’s 2002 study found TCO savings of 24% to 34%
when using OSS/FS instead of Microsoft’s proprietary approach;
their 2004 study found TCO savings from 19% to 36%.
Cybersource’s
2004 update of their
“Linux vs. Windows: Total Cost of Ownership Comparison”
(as noted in the
press)
found 19% to 36% savings using Linux, compared to Microsoft Windows,
depending on various factors (see their paper).
This is basically an update of
Cybersource’s
“Linux vs. Windows: Total Cost of Ownership Comparison”
2002 study, which
modeled an organization with 250 computer-using staff, an
appropriate number of workstations, servers,
with Internet connectivity, an e-business
system, network cabling and hardware, standard software, and salaries for IT
professionals to establish and support this infrastructure and technology.
Using existing hardware and infrastructure, they found a three-year
savings of 34.26% ($251,393 U.S. dollars) when using the
“Linux/Open Source Solution” instead of the proprietary
“Microsoft solution”.
When new hardware and infrastructure
were purchased, the savings were 24.69%.
Note that this study is a follow-on of
an even earlier study; a
commentary is available at Linux Journal.
It could be argued that this was merely a paper study, but
they claim that they’ve seen significant savings in their consulting work.
It’s also fair to note that this organization is pro-OSS/FS.
In any case, TCO savings have been reported by real organizations,
corroborating these results, as discussed below.
- An Italian study in 2002 found GNU/Linux to have a TCO 34.84% less
than Windows.
The
full study is in Italian;
you can try to read an automatically-generated
translation.
- For many circumstances, the total cost savings can be substantial.
For example, real-world savings exceeding $250,000 per year
were reported by 32% of the Chief Technical Officers (CTOs)
surveyed in a 2001 InfoWorld survey;
60% of these CTOs saved over $50,000 annually.
The August 27, 2001 InfoWorld (pages 49-50) reported on a survey of 40 CTOs
who were members of the InfoWorld CTO network.
In this survey, 32% using OSS reported savings greater than $250,000;
12% reported savings between 100,001 and $250,000; and 16% reported
saving between $50,001 and $100,000.
Indeed, only 8% reported annual savings less than $10,000
(so 92% were saving $10,000 or more annually).
A chief benefit of OSS, according to 93% of the CTOs, was reduced cost
of application development or acquisition; 72% said that a chief benefit
was reduced development or implementation time (multiple answers were allowed).
The CTOs reported using or planning to use OSS for web servers (65%),
server OSes (63%), web-application servers (45%),
application development testing (45%), and desktop OS (38%),
among other uses.
InfoWorld summarized it this way:
“in early 2000, it seemed as if no one was using open-source software
for business-critical tasks... a vast majority of today’s
corporate IT executives are now using or plan to use OSS OSes
and web servers for their enterprise applications.”
- The Robert Frances Group’s July 2002 study found
the TCO of GNU/Linux
is roughly 40% (less than half) that of Microsoft Windows
and only 14% that of Sun Microsystem’s Solaris.
The Robert Frances Group (RFG), in Westport, Conn., studied actual costs
at production deployments of Web servers running on
GNU/Linux with Apache, Microsoft Windows with IIS, and
Sun Solaris with Apache at 14 Global 2000 enterprises.
These are real deployments where, if the web server goes down,
money is lost - not minor prototype sites.
Their TCO analysis was based on the software purchase price,
hardware purchase and maintenance prices, software maintenance and
upgrade prices, and administrative costs.
To make the numbers comparable, these figures were
were scaled to a “processing unit” able to handle 100,000 hits per day;
see the study for more information.
They determined that over three years a (scaled)
GNU/Linux deployment cost $74,475, a Windows deployment
cost $190,662, and a Solaris deployment cost $534,020.
Thus, the cost of running GNU/Linux is roughly 40% that of Microsoft Windows
and only 14% that of Sun Microsystem’s Solaris.
This report also found that GNU/Linux and Solaris had smaller administrative
costs than Windows.
Although Windows system administrators cost less individually,
each Linux or Solaris administrator could administrate many more machines,
making Windows administration much more costly.
The study also revealed that Windows administrators
spent twice as much time patching systems and dealing
with other security-related issues than did
Solaris or GNU/Linux administrators.
RFG also examined some areas that were difficult to monetize.
In the end, they concluded that
“Overall, given its low cost and flexible licensing requirements,
lack of proprietary vendor goals,
high level of security, and general stability and usability,
Linux is worth considering for most types of server deployments.”
- Netproject reported that the TCO with Linux on the desktop
was 35% that of Microsoft Windows (a 65% savings).
Netproject’s
Cost of Ownership report found a very significant savings,
and it reported the following causes:
- The elimination of license fees for both the system software and
office software;
- Elimination of vendor churn that forces unnecessary software updates;
- Reduction in the number of software security updates;
- No need for anti-virus software for Linux computers
[anti-virus software for Linux is only needed to check for viruses
that run on Microsoft PCs];
- Reduction in the number of support staff.
- A majority of InternetWeek Newsbreak subscribers from
companies with over $5 million in revenues reported that OSS/FS
software costs substantially less than proprietary software.
A survey was by TheOpenEnterprise.com (a joint editorial
effort between InternetWeek.com and InformationWeek)
of individuals with management responsibility for IT and
software specifically in companies
with over $5 million in revenue.
In this survey,
39% said “open source/standards-based software”
costs 25% to 50% less than proprietary software,
while 27% (over 1 in 4) said it’ costs 50% to 75% less.
In context, it appears their phrase was intended to mean the same
(or similar) thing as the term OSS/FS in this paper, since in many cases
they simply use the term “open-source.”
As they note,
“Would your CFO react favorably to a 50-75% reduction
in software costs?”
-
A report by Research and Markets found
a number of cases where deploying open source software resulted in
significant savings.
The report
Saving Cash: A Comparison of Open Source and Proprietary Software
(Oct 2004, 95 pages)
on OSS/FS in Germany shows significant saving potentials
through the deployment of open source software for different company sizes.
The study found that the risk for users on account of copyright or
patent violations is minimal.
A set of interviews were used to create a detailed TCO model,
and they perform calculations with typical case studies.
Warning: This is an expensive report.
- The UK Government’s British Educational Communications and
Technology Association (Becta) found that using
OSS/FS could save a significant amount of money in primary and
secondary schools.
Becta is wrapping up a 3-year study that
analyzed a sample of 15 schools who use OSS/FS programs, comparing their
costs (and other factors) to 45 (originally 33) schools
which use proprietary software.
Becta found that secondary schools could reduce their information technology
overheads by 24% (including software, hardware, and support costs) by
switching to OSS/FS.
Primary schools could cut their computer costs by nearly half using OSS/FS.
Support costs (usually 60% of a PC’s total cost)
had the biggest reduction in cost.
Initial hardware costs were also lower,
because the OSS/FS (which they call FLOSS)
required less expensive hardware compared to the proprietary solutions.
They concluded that
“FLOSS can be implemented successfully with cost benefits” and that
“Use of office based FLOSS offers a cost-effective alternative
to proprietary solutions.”
The case studies showed that the cost advantages of OSS/FS
“were often used to increase provision, rather than reduce
overall budgets in schools.”
These results have been widely reported; see reports from
the Times Educational Supplement (TES),
ZDNet UK,
silicon.com,
and
eGov monitor.
Note that
Schoolforge has detailed report from a 14 April 2005 meeting
summarizing the report.
-
Many organizations report significant savings when using
OSS/FS.
Here are a few examples of specific organizations saving money
through OSS/FS:
-
The analysis Linux
as a Replacement for Windows 2000
compares Red Hat Linux 7.1 to
Windows 2000; in this customer’s case, using Linux instead
of Windows 2000 saved $10,000.
The reviewer came from a Windows/DOS background, and after performing
an intensive hands-on Linux project lasting several months, determined
that “you will be stunned by the bang for the buck
that ... open source software offers.”
-
Intel’s IT Vice President, Doug Busch,
reported savings of $200 million by replacing
costly Unix servers with cheaper servers running GNU/Linux.
-
Amazon.com was able to cut $17 million in technology expenses in a single
quarter, largely due to a switch to Linux.
Amazon spent
$54 million on technology and content expenses in its third quarter
(ending Sept. 30), compared with $71 million in the year-ago quarter, and
executives expected that technology costs as a portion of net sales
would decrease by 20% this year.
-
The city of Largo, Florida
reports a savings of $1 million per year using GNU/Linux and “thin clients.”
-
Dell offers a savings of 21% when using GNU/Linux.
Dell computer has a dedicated hosting service, such as their
D-2800 offering.
This service offers a respectable system (Pentium 850, 256MiB,
20GB, 21GB/month bandwidth) in two configurations:
Red Hat Linux 7.1 for $189/month, and Windows 2000 for $239/month.
Thus, with identical hardware and bandwidth provision,
the GNU/Linux system is 21% cheaper.
This is especially interesting because Dell is not out
to prove which system is better; as a business,
they’ve just figured out competitive prices at which they can offer their
services.
-
An independent report in Denmark concluded that
if the political goals for using the Internet to improve the public sector
are to be fulfilled, it would be $500 million cheaper over the next 10 years
to use OSS/FS instead of Microsoft software
(my thanks to Poul-Henning Kamp, who translated the conclusions).
There are many other reports from those who have switched
to OSS/FS systems; see the
usage reports section
for more information.
-
Even Microsoft has admitted that its products are more
costly than GNU/Linux.
For some time Microsoft has tried to convince users that its
products are somehow less costly.
However, as documented in
Var Business and
The Register,
Microsoft CEO Steve Ballmer in 2002
admitted that Microsoft has not
“figured out how to be lower-priced than Linux.
For us as a company, we’re going through a whole new world of thinking.”
The Register summarizes Microsoft’s new approach as saying that
“it costs more because it’s worth more”;
whether this is true is rather debatable in many cases,
but at least it’s a more sensible argument.
However, Microsoft has gone back to trying to claim that they cost less,
so the detail in this section is still needed.
- A Microsoft-sponsored study claims that Windows is cheaper
than Linux, but this has been debunked as a general claim.
The Microsoft-sponsored study
(available from Microsoft)
compared Windows 2000 to
Linux; it stated that Linux had lower TCO for webserving, and Windows 2000
had a lower TCO for network infrastructure, print serving, file serving
and security applications (note: the “David Wheeler” quoted
in InfoWorld is not the author of this paper).
I will give credit here: unlike the Mindcraft reports
sponsored by Microsoft, this TCO report
clearly states that it was sponsored by Microsoft, and I appreciate that.
It’s important to examine the assumptions of any TCO study, to see
if its assumptions could apply to many other situations - and
it is easily argued that they don’t.
Joe Barr
discusses some of the problems in this TCO study.
These include assuming that the operating system is never upgraded
in a 5-year period,
using an older operating system Microsoft is transitioning from,
and not using the current Enterprise license agreement (which many
organizations find they must use).
Costs that are not included in the study include legal advice costs
(when signing large-scale agreements),
purchase and maintenance of a software license inventory system
(which you’ll generally need even with Enterprise agreements),
costs if you are audited,
cost of insurance and liability incidents
(if a proof of purchase is misplaced, you might need to pay the
$151,000 per-incident liability),
and paying multiple times for the same product (a side-effect of many Enterprise
license agreements).
Barr concludes with:
“TCO is like fine wine: it doesn’t travel well.
What may be true in one situation is reversed in another.
What gets trumpeted as a universal truth ( ‘Windows is cheaper than Linux’ )
may or may not be true in a specific case,
but it is most certainly false when claimed universally.”
Since the TCO of a system depends on its application, and Microsoft as sponsor
could specifically set all of the parameters, the conclusions of the report
were easily predicted.
- Another Microsoft-sponsored study claims that Microsoft’s toolsuite
with .NET is cheaper than using GNU/Linux with J2EE.
This Giga Research study sponsored
by Microsoft
compared the costs incurred by five large and medium-size companies
that used J2EE (Java 2 Enterprise Edition) with the
costs incurred by seven large and medium-size companies that
used .Net applications
to develop Web portal applications.
For large corporations, the cost of using Microsoft products
(for development and deployment plus three years of maintenance)
was 28% less than for J2EE/Linux.
For medium-size companies, the Microsoft products were 25% cheaper.
However, once again, the TCO values all hinge on the assumptions made.
As CIO.com points
out,
the Microsoft-based solution was cheaper primarily because the
GNU/Linux systems were configured using extremely
expensive proprietary products
such as those from Oracle (for the database system) and BEA
(for the development system).
A company can certainly choose to use these particular products
when developing with GNU/Linux,
but not all organizations will choose to do so.
Indeed, the acronym “LAMP” (Linux, Apache, MySQL, and PHP/Python/Perl)
was coined because that combination is
extremely popular when creating web portal applications.
MySQL and PostgreSQL are popular OSS/FS database programs;
PHP, Python, and Perl are popular OSS/FS development languages
(and tie easily into the rest of the development suite provided by OSS/FS
operating systems).
An obvious question to ask is,
“Why were extremely common configurations (such as LAMP) omitted in this
Microsoft-funded study?”
CIO.com reports Giga’s answer:
“Microsoft didn’t ask them [to] look at any such companies.”
Again, I give credit to Giga for clearly reporting who funded the study.
Indeed, if your situation closely matches Giga’s study, your costs might be
very similar.
But it would be a mistake to conclude that different situations
would necessarily have the same results.
You may also want to see
MITRE Corporation’s business
case study of OSS,
which considered military systems.
Most of these items assume that users will use the software unmodified,
but even if the OSS/FS software doesn’t do everything required, that
is not necessarily the end of the story.
One of the main hallmarks of OSS/FS software is that it can be
modified by users.
Thus, any true TCO comparison should consider not just the products
that fully meet the requirements, but the existing options that
with some modifications could meet the requirements.
It may be cheaper to start with an existing OSS/FS program, and improve it,
than to start with a proprietary program that has all of the necessary
functionality.
Obviously, the total TCO including such costs varies considerably
depending on the circumstances.
Brendan Scott (a lawyer specializing in IT and
telecommunications law) argues that
the long run TCO of OSS/FS must be lower than proprietary software.
Scott’s paper makes some interesting points, for example,
“TCO is often referred to as the total cost of ‘ownership’...
[but] ‘ownership’ of software as a concept
is anathema to proprietary software,
the fundamental assumptions of which revolve around
ownership of the software by the vendor. ...
The user [of proprietary software] will, at best, have some form
of (often extremely restrictive) license.
Indeed, some might argue that a significant
(and often uncosted) component of the cost of ‘ownership’ of
proprietary software is that users don’t own it at all.”
The paper also presents arguments as to why GPL-like
free software gives better TCO results than other OSS/FS licenses.
Scott concludes that
“Customers attempting to evaluate a free software v. proprietary solution
can confine their investigation to an evaluation
of the ability of the packages to meet the customer’s needs,
and may presume that the long run TCO will favor the free software package.
Further, because the licensing costs are additional dead weight costs,
a customer ought to also prefer a free software solution
with functionality shortfalls where those shortfalls can be overcome
for less than the licensing cost for the proprietary solution.”
Microsoft’s first TCO study comparing Windows to Solaris
(mentioned earlier) is not a useful
starting point for estimating your own TCO.
Their study reported the average TCO at sites using Microsoft products
compared to the average TCO at sites using Sun systems, but
although the Microsoft systems cost 37% less to own,
the Solaris systems handled larger databases, more demanding applications,
63% more concurrent connections, and 243% more hits per day.
In other words, the Microsoft systems that did less work cost less than
systems that did more work.
This is not a useful starting point
if you’re using TCO to help determine which system to buy -
to make a valid comparison by TCO,
you must compare the TCOs of systems that meet your requirements.
A two-part analysis by Thomas Pfau (see
part 1 and
part 2)
identifies this and many other flaws in the study.
There are some studies that emphasize Unix-like systems, not OSS/FS,
which claim that that there are at least some circumstances where Unix-like
systems are less costly than Windows.
A Strategic Comparison of Windows vs. Unix by Paul Murphy is one
such paper.
It appears that many of these arguments would also apply to
OSS/FS systems, since many of them are Unix-like.
Be sure that you actually compute your own TCO; don’t just
accept a vendor’s word for it, and in particular, don’t just accept
a vendor’s claims for the TCO of its competitors.
In 2004 Newham council chose Microsoft products over
a mixed solution, reporting that their selected solution had a lower TCO
according to an independent study.
Yet
when the reports were made public in September 2004,
it was discovered that it
was Microsoft who created the cost figures of
switching to their competitor - not an independent source at all.
Any vendor (open or closed) can tell you why their competitor costs
more money, if you naïvely let them.
Again, it’s TCO that matters, not just certain cost categories.
However, given these large differences in certain categories,
in many situations OSS/FS has a smaller TCO than proprietary systems.
At one time it was claimed that OSS/FS installation took more time,
but nowadays OSS/FS systems can be purchased pre-installed and automatic
installers result in equivalent installation labor.
Some claim that system administration costs are higher, but studies like Sun’s
suggest than in many cases the system administration costs are lower,
not higher, for Unix-like systems (at least Sun’s).
For example, on Unix-like systems it tends to be easier to automate tasks
(because you can, but do not need, to use a GUI) - thus over time
many manual tasks can be automated (reducing TCO).
Retraining costs can be significant - but now that GNU/Linux has modern
GUI desktop environments, there’s anecdotal evidence that this cost is
actually quite small.
I’ve yet to see serious studies quantitatively
evaluating this issue, but anecdotally, I’ve observed that people familiar
with other systems are generally able to sit down and use
modern GNU/Linux GUIs without any training at all.
In short, it’s often hard to show that a proprietary
solution’s purported advantages really help offset their demonstrably
larger costs in other
categories when there’s a competing mature OSS/FS product for the
given function.
One factor that needs to be included in a TCO analysis is switching costs,
where that applies.
Thankfully,
most people remember to include the costs of switching to something.
As noted in
“IT analysts’ influence on open source adoption”,
Gartner Vice President Mark Driver
says that the best place for a company to
first deploy Linux in a large way is in a new-from-scratch
operation rather than as a replacement for Windows.
That’s because, “Gartner’s (and other analysts’) figures show
that migration from another operating system and
porting software written for the old operating system
are the two largest costs of a Linux migration, [so]
it is obvious -- at least to Driver -- that Linux TCO
drops radically when you avoid the migration step and install Linux
in the first place.”
However, don’t forget to include the extremely important
costs of switching away from a decision later.
As noted in
Linux Adoption in the Public Sector: An Economic Analysis
by Hal R. Varian and Carl Shapiro (University of California, Berkeley;
1 December 2003),
“a system that will be difficult to switch away from in the future,
in part because the lock-in associated with using such
a system[,] will reduce their future bargaining power with their vendor.
Vendors always have some incentive to make it difficult for users
to switch to alternatives,
while the users will generally want to preserve their flexibility.
From the user’s viewpoint, it is
particularly important to make sure that file formats, data,
system calls, APIs, interfaces,
communication standards, and the like are well enough documented
that it is easy to move data
and programs from one vendor to another.”
Obviously, someone who elects to use a proprietary program that locks them
into that specific program will almost certainly pay much higher
prices in future updates, because the vendor can exploit the user’s
difficulty in changing.
Clearly, if one product is significantly more productive than another
where it’s used, it’s worth paying more for it.
However, it’s clear that at least for major office tasks, GNU/Linux systems
are about as usable as Windows systems.
For example,
one usability study comparing GNU/Linux to Microsoft Windows XP
found that it was almost as easy to perform most
major office tasks using GNULinux as with Windows:
“Linux users, for example, needed 44.5 minutes to perform a set of tasks,
compared with 41.2 minutes required by the XP users.
Furthermore, 80% of the Linux users believed that they needed only one week
to become as competent with the new system as with their existing one,
compared with 85% of the XP users.”
The detailed report
(in German) is also available.
Does this mean that OSS/FS always have the lowest TCO? No! As I’ve
repeatedly noted, it depends on its use.
But the notion that OSS/FS always has the larger TCO is simply wrong.
In fairness, I must note that not all issues can be quantitatively measured,
and to many they are the most important issues.
The issues important to many include
freedom from control by another (especially a
single source),
protection from licensing litigation,
flexibility,
social / moral / ethical issues, and
innovation.
-
OSS/FS protects its users from the
risks and disadvantages of single source solutions.
While “free software” advocates use
the term “freedom,” and
some businesses emphasize different terms such as
“free market”, “multiple sources”,
“alternate supply channels”, and
“the necessity of multiple vendors”,
the issue is the same: users do not want to be held hostage by any one vendor.
Businesses often prefer to buy products in which there is a large set
of competing suppliers, because it reduces their risk;
they can always switch to another supplier if they’re not satisfied,
the supplier raises their prices substantially,
or the original supplier goes out of business.
This translates into an effect on the products themselves:
if customers can easily choose and switch
between competing products, the products’ prices
go down and their quality goes up.
Conversely, if there is a near or real monopoly for a given product,
over time the
vendor will continuously raise the cost to use the product and limit its
uses to those that benefit the monopolist.
Users who are unwilling to leave single source solutions often pay
dearly later as their single source raises their costs.
For example, many organizations have
chosen to use Microsoft’s products exclusively, and Microsoft is
trying to exploit this through its new
“Microsoft Licensing 6.0 Program.”
The
TIC/Sunbelt Software Microsoft Licensing Survey Results (covering
March 2002) reports the impact on customers
of this new licensing scheme.
80% had a negative view of the new licensing scheme, noting, for example,
that the new costs for software assurance
(25% of list for server and 29% of list for clients)
are the highest in the industry.
Of those who had done a cost analysis, an overwhelming 90%
say their costs will increase if they migrate to 6.0, and 76%
said their costs would increase from 20% to 300% from
what they are paying now under their current 4.0 and 5.0 Microsoft Licensing
plans.
This survey found that 36% of corporate enterprises
don’t have the funds to upgrade to
the Microsoft Licensing 6.0 Program.
Half indicated that the new agreement
would almost certainly delay their migration initiatives
to new Microsoft client, server and Office productivity platforms,
and 38% say they are actively seeking
alternatives to Microsoft products.
In
New Zealand a Commerce Commission Complaint has been filed
claiming that Microsoft’s pricing regime is anti-competitive.
Craig Horrocks notes that the Software Assurance approach
does not assure that the purchaser receives anything for the money;
it merely buys the right to upgrade
to any version Microsoft releases in the covered period.
Microsoft may levy further charges on a release, and the contract
does not obligate Microsoft to deliver anything in the time period.
There are increasing concerns about Microsoft’s latest releases of Windows.
Michael Jennings argues in
Windows XP Shows the Direction Microsoft is Going
that Microsoft users are increasingly incurring
invasion of privacy, intentionally crippled yet
necessary services, and other problems.
More generally, defining an organization’s “architecture” as being
whatever one vendor provides is sometimes called
“Vendor Lock-in” or “Pottersville”, and this “solution” is a
well-known
AntiPattern
(an AntiPattern is a “solution” that has more problems than it solves).
Having only one vendor completely control a market is dangerous from the
viewpoint of costs (since the customer then has
no effective control over costs), and
it also raises a security concern: the monoculture vulnerability.
In biology, it is dangerous to depend on one crop strain, because
any disease can cause the whole crop to fail.
Similarly, one proprietary vendor who completely controls a market
creates a uniformity that is far easier to massively attack.
OSS/FS programs provide an alternative implementation, and even when
one dominant OSS/FS program exists, because they can be
changed (because the source code is available) at least some
implementations are likely to be more resistant to attack.
Historically, proprietary vendors eventually lose to vendors selling
products available from multiple sources, even when their proprietary
technology is (at the moment) better.
Sony’s Betamax format lost to VHS in the videotape market,
IBM’s microchannel architecture lost to ISA in the PC architecture market,
and Sun’s NeWS lost to X-windows in the networking graphics market, all
because customers prefer the reduced risk (and eventually reduced costs)
of non-proprietary products.
This is sometimes called “commodification”, a term disparaged by
proprietary vendors and loved by users.
Since users spend the money, users eventually find someone who will provide
what they want, and then the other suppliers discover that they must
follow or give up the market area.
With OSS/FS, users can choose between distributors, and
if a supplier abandons them they can switch to another supplier.
As a result, suppliers will be forced to provide good quality products
and services for relatively low prices, because users can switch if they don’t.
Users can even band together and maintain the product themselves
(this is how the Apache project was founded), making it possible for groups
of users to protect themselves from abandonment.
The article
Commentary from a new user: Linux is an experience, not an operating system,
describes freedom this way:
“As I worked in Linux...
the word ‘free’ took on a far greater meaning.
As the advocates of the Open Source and Free Software movements put it,
free means freedom. Yes, as a humble user of Linux,
I am experiencing freedom and pride in using a world-class operating system.
Linux is not only an operating system.
It embodies a myriad of concepts about how the world of computers and software
should be.
This is an operating system designed by the world, meant for the world.
Everyone who is interested in Linux, can develop, share and use it.
People can contribute their best in programming,
documenting or in any aspect of their choice. What a novel concept!
Free in Linux spells freedom -- freedom to use Linux,
freedom to use the code, freedom to tweak and improve it.
Not being a programmer, I still can be happy about many things.
For me, freedom has meant that my operating system is transparent,
and there are no hidden codes at work in my computer.
Nothing about Linux is hidden from me.
... I’ve gained more control over my computer for the first time in my life.”
-
OSS/FS protects its users
from licensing litigation and management costs.
Proprietary vendors make money from the sale of licenses, and are
imposing increasingly complex mechanisms on consumers to
manage these licenses.
For example, Microsoft’s Windows XP requires product activation -
a scheme that means that an accumulation of hardware changes
requires a new activation code.
A license no longer gives unlimited rights to reinstall -
if you have hardware trouble, you may
end up being forced to re-buy your product.
Indeed, for a variety of reasons,
businesses are finding that they must buy the same
proprietary software more than once.
Proprietary vendors
also litigate against those who don’t comply with their complex licensing
management requirements, creating increased legal risks for users.
For example, the Business Software Alliance (BSA) is
a proprietary software industry organization sponsored by Microsoft,
Macromedia, and Autodesk, and spends considerable time
searching for and punishing companies who cannot prove they are complying.
As noted in the
SF Gate (Feb. 7, 2002),
the BSA encourages disgruntled employees to call the BSA if they know
of any license violations.
“If the company refuses to settle or if the BSA feels the company is
criminally negligent and deliberately ripping off software,
the organization may decide to get a little nastier and organize a raid:
The BSA makes its case in front of a federal court in the company’s
district and applies for a court order.
If the order is granted, the BSA can legally storm
the company’s offices, accompanied by U.S. marshals,
to search for unregistered software.”
Software Licensing
by Andrew Grygus discusses the risks and costs of
proprietary licensing schemes in more detail.
According to their article,
“the maximum penalty is $150,000 per license deficiency;
typically, this is negotiated down,
and a company found deficient at around $8,000 will
pay a penalty of around $85,000 (and must buy the $8,000 in software too).”
For example,
information services for the city of Virginia Beach, VA
were practically shut down for over a month and 5 employees
(1/4th of their staff) had to be
dedicated to put its licensing in order to answer a random audit
demand by Microsoft, at a cost of over $80,000.
Eventually the city was fined $129,000 for missing licenses the
city had probably paid for but couldn’t match to paperwork.
Temple
University had to pay $100,000 to the BSA,
in spite of strong policies forbidding unauthorized copying.
To counter these risks, organizations must keep careful track
of license purchases.
This means that organizations must impose strict software license
tracking processes, purchase costly tracking programs, and pay for
people to keep track of these licenses and perform occasional audits.
A related problem is that companies using proprietary software must, in
many cases, get permission from their software vendors to sell
a business unit that uses the proprietary software, or face legal action.
For example,
Microsoft has filed objections to Kmart’s proposed $8.4 million sale
of Bluelight.com to United Online Inc., citing software licensing as
one of their concerns.
Microsoft stated that “The licenses that debtors (Kmart)
have of Microsoft’s products are licenses of copyrighted materials and,
therefore, may not be assumed or assigned with[out] Microsoft’s consent.”
Whether or not this is a risk depends on the licensing scheme used;
in many cases it appears that the legal
“right of first sale” doctrine cannot be applied
(for example, there are many different licensing schemes for Windows, so
the same action with Windows may be legal or not depending
on the licensing scheme used to acquire it).
In contrast,
OSS/FS users have no fear of litigation from the use and copying of OSS/FS.
Licensing issues do come up when OSS/FS software is modified and then
redistributed, but to be fair, proprietary software essentially forbids
this action (so it’s a completely new right).
Even in this circumstance, redistributing modified OSS/FS software
generally requires following only a few simple rules (depending on the license),
such as giving credit to previous developers
and releasing modifications under the same license as the original program.
One intriguing example is
the musical instrument company Ernie Ball,
described in World Trade, May 2002.
A disgruntled ex-employee turned them into the
Business Software Alliance (BSA); who then arranged to have them
raided by armed Federal Marshals.
Ernie Ball was completely shut down for a day, and then was required
to not touch any data other than what is minimally needed
to run their business.
After the investigation was completed, Ernie Ball was found
to be noncompliant by 8%; Ball argued that it was
“nearly impossible to be totally compliant” by their rules, and felt
that they were treated unfairly.
The company ended up paying a $90,000 settlement,
$35,000 of which were Microsoft’s legal fees.
Ball then decided at that moment his company would
become “Microsoft free.”
In one year he converted to a
Linux-based network and UNIX “mainframe” using Sun’s
StarOffice (Sun’s proprietary cousin to OpenOffice);
he now has no Microsoft products at all, and much of the software is
OSS/FS or based on OSS/FS products.
-
OSS/FS has greater flexibility.
OSS/FS users can tailor the product as necessary to meet their needs
in ways not possible without source code.
Users can tailor the product themselves, or hire whoever
they think can solve the problem (including the original developer).
Some have claimed that this creates the “danger of forking,” that is,
of multiple incompatible versions of a product.
This is “dangerous” only to those who think competition is evil -
we have multiple versions of cars as well.
And in practice, the high cost of maintaining software yourself has
resulted in a process in which the change is contributed back to the
community.
If it’s not contributed (e.g., it solves a problem that needed solving but
only for a specialized situation),
then it’s still a win for the user - because
it solved a user’s problem which would have been unsolved otherwise.
For example,
in 1998 Microsoft decided against developing an Icelandic version
of Windows 95 because the limited size of the market couldn’t justify
the cost.
Without the source code, the Islandic people had little recourse.
However, OSS/FS programs can be modified, so Icelandic support was
immediately added to them, without any need for negotiation with a vendor.
In contrast, in
July 2004,
Welch support for in the OSS/FS OpenOffice.org became available, the
first complete office environment available in Welsh.
Users never know when they will have a specialized need not
anticipated by their vendor; being able to change the source code makes
it possible to support those unanticipated needs.
The
IDC study “Western European End-User Survey: 2005 Spending Priorities, Outsourcing, Open Source, and Impact of Compliance”
surveyed 625 European companies of over 100 employees.
They found that 25% had significant OSS/FS operating system (Linux)
deployments (beyond limited deployments or pilots),
and 33% had significant OSS/FS database deployments.
The most important cited OSS/FS benefit wasn’t lower cost, but
was the flexibility of deploying whenever they wanted without having to
negotiate anything.
In addition, many companies specifically stated that
a key advantage of OSS/FS was the flexibility provided
because it could be customized;
this wasn’t one of the multiple-choice answers, yet many companies added
it as a comment.
-
Many believe that there are social, moral, or
ethical imperatives for using OSS/FS.
The Free Software Foundation has
a set of papers describing their philosophy, i.e., why they believe
Free Software is an ethical imperative.
These lengthy documents explain themselves in depth, so there’s
little need to describe them further here.
-
There is ample evidence that
OSS/FS encourages, not quashes, innovation.
Innovation is a strength, not a liability, for OSS/FS.
InformationWeek’s survey of business-technology professionals
“Open-Source Software Use Joins The Mix”, published in November 2004,
found that OSS/FS “is believed to create more opportunities
for innovation than commercial or proprietary software.”
Nearly 60% of the companies with annual revenue of $100 million or
more stated that OSS/FS creates more opportunities for innovation.
Small businesses (less than $100 million), where much innovation
takes place, agreed even more strongly;
“almost three-quarters report open-source software
readily promotes more opportunities for IT innovation.”
This is consistent with previous surveys of expectations.
The February 2001 research paper
Distributed Knowledge and the Global Organization of Software Development
by Anca Metiu and Bruce Kogut
(The Wharton School, University of Pennsylvania)
reports on field observations of companies in four countries.
They state that,
“the open development model opens up the ability to
contribute to innovation on a global basis.
It recognizes that the distribution of natural intelligence
does not correspond to the monopolization of innovation
by the richest firms or richest countries.
It is this gap between the distribution of ability
and the distribution of opportunity that the web will force companies to
recognize, and to realign their development strategies.
For the young engineer in India, China, or Israel -
who cannot or does not want to come to the Silicon Valley,
or the Research Triangle,
or Munich - is increasingly able to contribute to world innovation.”
In 2000,
a Forrester Research study interviewed 2,500 IT managers and found that
84% of them forecast that open source software would be the spark
behind major innovations throughout the industry
It’s not just business people and observers of them; software
developers themselves report that OSS/FS projects are often innovative.
According to the BCG study of OSS/FS
developers,
61.7% of surveyed developers
stated that their OSS/FS project was either their
most creative effort or was equally as creative as their
most creative experience.
Government employees also report that OSS/FS supports innovation;
Federal Computer Week (FCW) published the article
“Linux use drives innovation:
FBI info-sharing project is one of a growing list of open-source successes”.
The article
declares that the
“open-source operating system [Linux]’s flexibility allowed
engineers greater freedom to tailor technology to their needs”
and that
“Linux is well-suited to federal projects with small teams
and scarce resources... many Linux applications,
such as the Census Bureau’s Fast Facts service,
can support an entire enterprise.”
There are many examples showing how innovation OSS/FS occurs.
Eric S. Raymond’s widely-read essay
The Cathedral and the Bazaar
describes one case of this happening in his project, fetchmail.
He had been developing a product to do one job, when
a user proposed an approach that changed the entire nature of
his project.
In Raymond’s words,
“I realized almost immediately that a reliable implementation of this feature
would make [a significant portion of the project] obsolete.”
He found that
“Often, the most striking and innovative solutions come from
realizing that your concept of the problem was wrong” and that
“the next best thing to having good ideas is recognizing good
ideas from your users. Sometimes the latter is better.”
In February 2005,
Roman Kagan noted that the Linux kernel “hotplug” system could be
greatly simplified.
The maintainer of the hotplug system, Greg K-H, replied by saying
“You know, it’s moments like this that I really think the open source
development model is the best. People are able to look into a project
and point out how stupid the original designers/authors are at any
moment in time :) You are completely correct, I love your [approach].
With it, and a few minor changes ... we don’t need
_any_ of the module_* programs
in the hotplug-ng package I just released. That is wonderful, thank you
so much for showing me that I was just working in circles.
In short, OSS/FS enables interaction between developers and users,
as well as interaction between developers, that can encourage innovation.
This is not a new phenomenon;
many key software-related innovations have been OSS/FS projects.
For example,
Tim Berners-Lee, inventor of the World Wide Web,
stated in December 2001 that
“A very significant factor [in widening the Web’s use beyond
scientific research] was that the software was
all (what we now call) open source.
It spread fast, and could be improved fast - and it
could be installed within government and large industry
without having to go through a procurement process.”
The Internet’s critical protocols, such as TCP/IP,
have been developed and matured through the use of OSS/FS.
The
Firefox
web browser has some very interesting innovations, such as
live bookbooks
(making RSS feeds look just like bookmark folders, and enabling
simple subscription), as well as incorporating innovations from
other browsers such as tabbed browsing and pop-up blocking.
Indeed,
many people are working hard to create new innovations for the next version
of Firefox.
Leading innovation expert
Professor Eric von Hippel is
the head of the management of innovation and entrepreneurship group at the
Massachusetts Institute of Technology (MIT) Sloan School of Management.
He has studied in detail how innovation works,
including how it works in the development of OSS/FS programs.
His studies suggest that OSS/FS can significantly enable innovation.
In the interview
Something
for nothing of von Hippel and Karim Lakhani,
they report that “Apache and other open-source programs are examples
of user-to-user innovation systems.”
von Hippel explained that
“Users may or may not be direct customers of the manufacturer.
They may be in different industries or segments of
the marketplace, but they are out in the field trying to do something,
grappling with real-world needs and concerns.
Lead users are an innovative subset of the user community displaying
two characteristics with respect to a product, process or service.
They face general needs in a marketplace but face them
months or years before the rest of the marketplace encounters them.
Since existing companies can’t customize solutions good enough for them,
lead users go out there, patch things together and
develop their own solutions.
They expect to benefit significantly by obtaining solutions
to their needs.
When those needs are evolving rapidly, as is the case in many
high-technology product categories,
only users at the front of the trend will have experience
today with tomorrow’s needs and solutions.
Companies interested in developing functionally
novel breakthroughs... will want to find out how to track lead users
down and learn from what they have developed...”
He closes noting that,
“We believe Apache and open source are terrific examples
of the lead user innovation process that can take
teams and companies in directions they wouldn’t have otherwise imagined.”
von Hippel has elsewhere noted that in certain industries
approximately 80% of new developments are customer based;
vendors ignore customers at their peril.
For more information on this work relating to OSS/FS, innovation, and
user interaction, see
Nik Franke and Eric von Hippel’s
Satisfying Heterogeneous User Needs via Innovation Toolkits: The Case of Apache Security Software,
Karim Lakhani and Eric von Hippel’s
How Open Source Software Works: Free User to User Assistance,
Eric von Hippel’s
Horizontal innovation networks- by and for users,
Eric von Hippel and Georg von Krogh’s
Exploring the Open Source Software Phenomenon: Issues for Organization Science
(which proposes that OSS/FS development is a compound innovation model,
containing elements of both private investment and collective action),
and Eric von Hippel’s
Open Source Shows the Way - Innovation By and For Users - No Manufacturer Required.
Other academics who study innovation have come to similar conclusions.
Joachim Henkel (at Germany’s University of Munich,
Institute for Innovation Research) wrote the paper
”The Jukebox Mode of Innovation - a Model of Commercial Open Source Development”.
In it, he creates a model of innovation in software, and finds that
“free revealing of innovations is a profit-maximizing strategy...
a regime with compulsory revealing [e.g., copylefting licenses]
can lead to higher product qualities and higher profits than
a proprietary regime”.
Tzu-Ying Chan and Jen-Fang Lee
(at Taiwan’s National Cheng Chi Univerity
of Technology & Innovation Management) wrote
”A Comparative Study of Online User Communities Involvement In Product Innovation and Development”,
which identified a number of different types of online user communities.
They discussed in particular the “user product collaboration
innovation community”, noting that firms must play a
supporting/complementary role for effective inteactions with this community,
a role very different from its interactions
with many other kinds of communities.
Yuwei Lin’s PhD thesis (at the UK’s University of York, Science and
Technologies Studies Unit, Department of Sociology),
Hacking Practices and Software Development: A Social Worlds Analysis of
ICT Innovation and the Role of Free/Libre Open Source Software
examines the social world of OSS/FS developers and its implications.
Its major findings are (I quote but use American spelling):
- As a community of open source practices,
the FLOSS social world allows diverse actors to engage in the
innovation process and therefore contains more innovation resources than other
relatively conventional software models.
- The strategic collaboration between the public
(i.e., the free software community) and the private
(i.e., information technologies corporations) sectors symbolizes
a pattern of hybrid
innovation that entails complex communications and networks.
- Tacit knowledge anchored in everyday experiences is peculiarly
valued in a community-based
innovation system where social networking and information sharing are
undergoing vigorously.
- The development of FLOSS democratizes [the] software innovation
process and allows lay people to develop their understanding and
knowledge of a shared problem/issue, especially through the web,
to challenge established views on the issue.
On September 14, 2004,
The Economist (a highly respected magazine)
awarded Linus Torvalds an award for innovation,
specifically as someone driving the most financially
successful breakthrough in computing, for his work on the Linux kernel.
His citation declares that this OSS/FS project
“created a huge following, eventually attracting big
industry players such as Oracle, IBM, Intel, Netscape and others.
It also spawned several new software companies,
including Red Hat, SUSE LINUX and Turbolinux.
Today, there are hundreds of millions of copies of Linux
running on servers, desktop computers, network equipment
and in embedded devices worldwide.”
The Committee for Economic Development (a 60-year-old pro-business
think tank)
reports
that
“Open source software is increasingly important as a source of innovation;
it can be far more reliable and secure than proprietary software
because talented programmers around the world can examine the code
and try to break its security, without having to worry about
hidden backdoors or holes.”
This history of innovation shouldn’t be surprising;
OSS/FS approaches are based on the
scientific method, allowing anyone to make improvements or add
innovative techniques and then make them immediately available to the public.
Eric Raymond
has made a strong case for why innovation is more likely, not less likely,
in OSS/FS projects.
Clearly, if you have an innovative idea, OSS/FS makes it very easy
to combine pre-existing code in novel ways, modifying them and recombining
them in any way you wish.
Hosting systems such as SourceForge
and Savannah provide easy access to vast amounts of source code.
There’s even a
specialized
search engine to find OSS/FS code named
Koders.com, allowing
for quick reuse of a variety of components.
This unfettered access to source code for arbitrary purposes, without
royalty restrictions, makes it easy to try out new ideas.
The Reuters story “Plugged in - Next Big Tech Ideas May Be Small Ones”
by Eric Auchard (April 2, 2005)
notes that OSS/FS has reduced (by orders of magnitude) the cost of
implementing new ideas, making it easier to start new businesses and products
so that they can be brought to the marketplace.
In public, Microsoft has long asserted that OSS/FS cannot innovate,
or at least cannot innovate as well as Microsoft can.
At first, the argument seems reasonable: why would anyone innovate
if they (or at least their company) couldn’t exclusively
receive all the financial benefits?
But while the argument seems logical, it turns out to be untrue.
In February 2003,
Microsoft’s Bill Gates admitted that
many developers are building innovative capabilities using OSS/FS systems.
Microsoft’s own secret research (later leaked as
“Halloween I”)
found that
“Research/teaching projects on top of Linux are
easily ‘disseminated’ due to the wide availability of Linux source.
In particular, this often means that new research ideas are
first implemented and available on Linux before they are
available / incorporated into other platforms.”
In contrast,
when examining the
most important software innovations, it’s quickly discovered that
Microsoft invented no key innovations,
nor was Microsoft the first implementor of any of them.
In fact,
there
is significant evidence that Microsoft is not an innovator at all.
Thus the arguments, while sounding logical, ignore how innovation really
occurs and what researchers say are necessary.
Innovation requires that researchers be able to publish and discuss their work,
and that leading-edge users be able to modify and integrate components
in novel ways; OSS/FS supports these requirements for innovation very well.
If proprietary approaches were better for research, then
you would expect that to be documented in the research community.
However, the opposite is true;
the paper
“NT Religious Wars: Why Are DARPA Researchers Afraid of Windows NT?”
found that, in spite of strong pressure by paying customers,
computer science researchers strongly resisted basing research on
Microsoft Windows.
Reasons given were: developers believe Windows is terrible,
Windows really is terrible, Microsoft’s highly restrictive
non-disclosure agreements are at odds with researcher agendas,
and there is no clear technology transition path for OS
and network research products built on Windows.
This last problem is especially interesting: you’d think that
if you could improve a popular product, the improvement would get to
users more quickly.
But innovation doesn’t work this way usually; most research creates prototypes
that aren’t products by themselves, and requires signficant interaction
between many people before the idea comes to fruition.
In proprietary products, usually
only the vendor can distribute changes, and publishing
the detailed source code explaining the work is prohibited,
stifling research.
In contrast,
NSA’s Security-Enhanced Linux (SELinux) project could simply take
GNU/Linux code, modify it however they liked to try out new concepts,
and publish all the results
for anyone to productize.
In contrast, if an innovation requires the cooperation of a proprietary
vendor, it may not happen at all.
HP developed new technology for choking off the spread of viruses,
but although HP got it to work well in its labs using systems like Linux,
they couldn’t duplicate the capability on Windows systems
because “we [HP] don’t own Windows.”
Stanford Law School professor Lawrence Lessig
(the “special master” in Microsoft’s antitrust trial)
noted that
“Microsoft was using its power to protect itself against new innovation”
and that Microsoft’s practices generally threaten technical innovation -
not promote it.
The claim that OSS/FS quashes innovation is demonstrably false.
There are reports from IT managers that OSS/FS encourages innovation,
reports from developers that OSS/FS encourages innovation,
and a demonstrated history of innovation by OSS/FS
(such as in the development of the Internet and World Wide Web).
In contrast,
Microsoft fails to demonstrate major innovations itself,
there is dissatisfaction by researchers and others
about Microsoft’s proprietary approaches,
and Microsoft’s own research found
that new research ideas are often first implemented and available
on OSS/FS.
This doesn’t mean that having or using OSS/FS automatically provides
innovation, and certainly proprietary developers can innovate as well.
And remember that
innovation is not as important as utility; new is not always better!
But clearly OSS/FS does not impede innovation; the
evidence suggests that in many situations OSS/FS is
innovative, and some evidence suggests that OSS/FS may
actively aid innovation.
While I cannot quantitatively measure these issues well, these
issues are actually the most important issues to many.
Some avoid OSS/FS, not due to the issues noted earlier, but
due to unnecessary fears of OSS/FS.
Let’s counter some of them:
-
Is proprietary software fundamentally
better supported than OSS/FS? No.
There are actually two kinds of support for OSS/FS: traditional
paid-for support and informal community support.
It’s also important to note that proprietary vendors often drop support
for their products over time; there is no real recourse for proprietary
products users, while there are recourses for OSS/FS users.
There are many organizations who provide traditional support for a fee;
since these can be competed (an option not available for proprietary
software), you can often get an excellent price for support.
Again, an anti-trust lawyer would say that OSS/FS support is “contestable.”
For example, many GNU/Linux distributions
include installation support when you
purchase their distribution, and for a fee they’ll provide additional
levels of support;
examples of such companies include
Red Hat,
Novell (SuSE),
Mandriva (formerly MandrakeSoft),
and
Canonical Ltd (which supports
Ubuntu,
a derivative of Debian GNU/Linux).
There are many independent organizations that provide traditional
support for a fee as well.
Some distributions projects are actively supported
by a large set of companies and
consultants you can select from; examples include
Debian GNU/Linux
and
OpenBSD.
The article
‘Team’work Pays Off for Linux
evaluated four different technical support services for GNU/Linux systems,
and found that “responsiveness was not a problem with any
of the participants” and that
“No vendor failed to solve the problems we threw at it.”
Many other organizations exist to support very specific products;
for example,
Mozilla Firebird and Thunderbird support available from
decisionOne and
MozSource,
for many years
AdaCore (aka AdaCore Technologies or ACT) has sold commercial support
for the OSS/FS Ada compiler GNAT,
and
MySQL AB sells commercial support
for its OSS/FS relational database system.
It’s very important to understand that OSS/FS support can be competed
separately from the software product; in proprietary products,
support is essentially tied to purchase of a usage license.
In the meantime, users can minimize any ‘fitness for purpose’ risks
through evaluation and testing, and by only using production releases
of well-known, mature products from reputable distributors.”
Indeed, this prediction seems nearly certain, since it’s been happening
and accelerating for years.
As an alternative to paid support, you can also
get unpaid support from the general community of users and developers through
newsgroups, mailing lists, web sites, and other electronic forums.
While this kind of support
is non-traditional, many have been very satisfied with it.
Indeed, in 1997 InfoWorld awarded the “Best Technical Support” award
to the “Linux User Community,”
beating all proprietary software vendors’ technical support.
Many believe this is a side-effect of the Internet’s pervasiveness -
increasingly users and developers are directly communicating with each other
and finding such approaches to be more effective than the alternatives
(for more on this business philosophy, see
The Cluetrain Manifesto).
Using this non-traditional approach effectively for support
requires following certain rules; for information on these rules, consult
“How
to ask smart questions” and
How to
Report Bugs Effectively.
But note that there’s a choice; using OSS/FS does not require you
to use non-traditional support (and follow its rules),
so those who want guaranteed traditional
support can pay for it just as they would for proprietary software.
And it’s important to remember that for a proprietary product, the
vendor can at any time decide to end support for a product -- while
there is always an alternative for OSS/FS users.
This is especially a risk if a company goes out of business, is
bought out, changes to a different market, or if the market becomes too
small.
But this can happen even when the company is profitable, doesn’t
change its basic market, the market is large, and there are many
established users.
After all, the vendor may have priorities not aligned with yours, and
the vendor is usually the only organization that may make improvements
and sell the product.
An extreme example of how a commercial vendor can abandon its users has been
Microsoft’s abandonment of the vast number
of companies who use Visual Basic 6.
Many large organizations have developed large infrastructures
that depend on Visual Basic 6,
and one survey
reports that 52% of all software developers use Visual Basic
(at least occasionally);
one developer
estimates that this plan abandons about 18 million software developers,
of which an estimated 6 million are professionals,
who developed tens of millions of Visual Basic applications.
When Microsoft developed its
“.NET” infrastructure, it also created a new product that it called
“Visual Basic for .NET” (VB.NET).
Unfortunately, VB.NET is completely incompatible with
the Visual Basic 6 language so widely used by industry, so the
millions of lines of code written using Visual Basic over many years
cannot be used with VB.NET without essentially rewriting the programs
from scratch.
(the
migration wizard is essentially useless because
there are just so many incompatibilities).
A
former Microsoft VB product manager, Bill Vaughan,
coined the name “Visual Fred” for VB.NET to emphasize how different
the new product was from the old one, and
the term “Visual Fred” for VB.NET rapidly caught on.
This is an enormous expense; if it takes on average $4,000 to
to rewrite a Visual Basic application, and only 10% of an
estimated 30 million applications need to be rewritten, that means customers
will end up paying $12 billion dollars just to rewrite their software
(without new functionality).
Surveys show that Visual Basic 6 is still far more popular than VB.NET;
a 2004 survey found that
80% used Visual Basic 5 or 6, while only 19% used VB.NET.
A
protest petition has been signed by more than 2,000 people
(including 222 MVPs),
and many companies have complained about the enormous and completely
unnecessary expense of rewriting their programs just because
Microsoft stopped supporting the original language.
Nevertheless, Microsoft has decided to abandon Visual Basic 6
(mainstream support for VB6 ends on March 31, 2005), in spite
of the outcry from most of its users.
Since there never was a standard for Visual Basic, and its implementation
is proprietary without obvious alternatives,
Visual Basic 6 users are stuck; they cannot
take over development themselves, as would be possible for an OSS/FS program.
Instead, the majority of Visual Basic developers are
switching to other languages, primarily C# and Java.
For example,
Evans Data found
that of those who weren’t staying with Visual Basic 6,
only 37% of Visual Basic 6 users planned to switch to VB.NET;
31% said they plan to move to Java and 39%
said they will be migrating to C#.
You can see
ClassicVB.org for more information.
This has the ire of many who normally support Microsoft;
Kathleen Dollard said,
“It is unconscionable (and should be illegal) for Microsoft
to end mainstream support until everyone who made a good faith effort
in light of their business environment has made the switch”
You could say that
this
extreme unwanted expense was the just punishment for developers
who unwisely chose to use a language with no standard, no alternative
implementation, and no mechanism to gain support if the vendor decided to
stop supporting the original product.
But this is little consolation for those many who have programs
written in the now-abandoned Visual Basic 6, since they cannot be handled
by the new VB.NET.
In contrast, many OSS/FS programs have been “abandoned” or had
major changes in strategy contrary to their user’s interests, but
support did not end.
Apache grew out of the abandonment of the NCSC web server program -- users
banded together and restarted work, which quickly became the #1 web server.
The GIMP was abandoned by its original developers, before it
had even been fully released; again, users banded together and refounded
the project.
The XFree86 project changed its licensing approach to one incompatible
with many customer’s requirements and failed to respond to the needs of
many users; this led to the founding of another project that replaced it.
Of course, if you are the only user of an OSS/FS project, it may not be worth
becoming the lead of a “follow-on” project -- but you at least
have the right to do so.
An OSS/FS project cannot work too far against the
interests of its users, because the users can wrest control away from
those who try.
-
Does proprietary software give users more legal rights than OSS/FS? Or, isn’t OSS/FS legally more risky? No.
Some have commented that “with OSS/FS you give
up your right to sue if things go wrong.”
The obvious retort is that essentially all proprietary software licenses
also forbid lawsuits - so this isn’t different at all!
Anyone who thinks that they can sue Microsoft or other shrink-wrap
proprietary vendors when things go wrong is simply fooling themselves.
In any case, most users aren’t interested in suing vendors -
they want working systems.
See
“A Senior Microsoft Attorney Looks at Open-Source Licensing”, where
Bryan Pfaffenberger argues that
“With open-source software...
you are, in principle, walking into the deal with your eyes wide open.
You know what you’re getting, and if you don’t, you can find someone who does.
Open-source licenses enable the community of users
to inspect the code for flaws and to trade knowledge about such flaws,
which they most assuredly do. Such licenses allow
users to create derivative versions of the code that repair
potentially hazardous problems the author couldn’t foresee.
They let users determine whether the program contains adequate safeguards
against safety or security risks. In contrast, the
wealthy software firms pushing UCITA are asking us
to buy closed-source code that may well contain flaws, and even
outright hazards attributable to corporate negligence - but they won’t
let us see the code, let alone modify it. You don’t
know what you’re getting.”
Finally, if the software goes wrong and it’s very important, you can
fix it yourself or pay to have it fixed; this option greatly reduces
risk, and this option doesn’t exist for proprietary software.
There is a another legal difference that’s not often mentioned.
Many proprietary programs require that users permit software license
audits and pay huge fees if the organization can’t prove that every
use is licensed.
So in some cases, if you use proprietary software, the biggest legal
difference is that the vendors get to sue you.
There are some claims that OSS/FS creates special risks to users, but
this doesn’t seem to be true in practice.
Pillsbury Winthrop LLP
noted that
“The suggestion that users of [OSS/FS] software are more likely
to be sued for patent infringement than those that
use proprietary software, like Microsoft’s does not appear
supported by actual experience.
It is interesting to note that while Microsoft has had several
dozen patent infringement lawsuits filed against it in the past
few years, none have been reported against Linux,
the most popular of all [OSS/FS] programs.”
Linda M. Hamel, General Counsel, Information Technology Division,
Commonwealth of Massachusetts
concluded that
“Use of either open source or proprietary software poses some legal
risk to states. States face fewer risks in connection with
the use of open source software compared to their private
sector counterparts, and the risks that they do face can be managed.”
(Groklaw further commented on this).
On February 7, 2005,
BusinessWeek published an opinion piece by
by Stuart Cohen of the Open Source Development Lab (OSDL); in that
piece, he stated that
SCO’s attempt to sue IBM on Linux-related issues
resulted in accelerating its popularity and strengthening its
legal foundation.
He noted that many Linux developers, assisted by such interested parties,
went to work to systematically examine every claim SCO put forth,
and they investigated and vetted the code in great depth.
-
Aren’t OSS/FS programs simply plagerized proprietary programs? No.
A programmer who has access to the source code of one program
could illegally take that code and submit it to another related program.
There are good reasons to believe
this has happened many times in proprietary programs; since
few people can view the source code of two different proprietary programs,
some programmers may do it in the (plausible) belief that they won’t be caught.
However, it’s unlikely that a programmer would copy code from a
proprietary program to an OSS/FS program without permission, because
(1) the worldwide visibility of most
OSS/FS source code would make it easy for a proprietary vendor
to detect the violation, and
(2) the clear record of exactly who submitted the plagerized code would
make it easy to prosecute that lawbreaking programmer.
A proprietary company could conceivably conspire to insert such code to
try to discredit their OSS/FS competitor.
But the risk of tracing such an attack back to the conspirator is very great;
the developer who does it is likely to talk and/or other evidence
may provide a trace back to the conspirators.
Alternatively, a proprietary company can claim that such an
event has happened, without doing it,
and then use the false claim to spread fear, uncertainty, and doubt.
But in that case, eventually the case will fall apart due
to lack of evidence.
A few years ago The SCO Group, Inc., began claiming that
the Linux kernel contained millions of lines of its copyrighted code, and
sued several companies including IBM.
SCO has vocally supported several lawsuits,
funded at least in part by Microsoft (via Baystar and a license purchase
with no evidence that it will be used).
Yet after repeatedly being ordered by a court to produce
its evidence,
SCO has yet to produce any evidence that code owned by SCO
has been copied into the Linux kernel.
Indeed, it’s not even clear that SCO owns the code it claims to own
(it’s in dispute with Novell on this point).
In addition,
Open Source Risk Management (OSRM) did a detailed code analysis, and
certified in April 2004
that the Linux kernel is free of copyright infringement.
SCO claims that its contracts with IBM give it ownership over IBM-developed
code, but previous documents relating to this contract inherited by SCO
(such as newletter explanations from AT&T and
a previous court case involving BSD) give extremely
strong evidence that this is not true.
More information on the SCO vs. IBM case can be found at
Groklaw.net.
In 2004 Ken Brown, President of Microsoft-funded ADTI, claimed that
Linus Torvalds didn’t write Linux, and in particular claimed that
Torvalds stole much of his code from Minix.
Yet it turns out that ADTI had previously hired
Alexey Toptygin to find copying between Minix and Linux using automated
tools, and
Toptygin found that no code was copied from Minux to Linux or
from Linux to Minux.
Andrew Tanenbaum, the author of Minix, strongly refuted Brown’s
unsubstantiated claims in a
statement,
follow-up, and
rebuttal.
For example, Tanenbaum stated that
“[Linus Torvalds] wrote Linux himself and deserves the credit.”
Tanenbaum also discredited Brown’s claim that no one person could write a
basic kernel; Tanenbaum noted that there are
“six people I know of who (re)wrote UNIX [and] all did it independently.”
Other
reports find many reasons to believe that ADTI’s claims are false;
for example, the Associated Press noted that
Recent attacks on Linux come from dubious source.
There are a vast number of OSS/FS programs, almost none of which are involved
in any dispute.
No reasonable evidence has surfaced to justify the most publicized claims
(of SCO and ADTI);
these claims can be easily explained as attempts by
a vendor to stall a competitor through the courts
(see the terms barratry and vexatious litigation) and unfounded claims.
There may be some cases, but given the widespread visibility of OSS/FS
source code, and the lack of plausible cases, they must be extremely rare.
Thus, there is strong evidence that people really are (legally)
developing OSS/FS programs, and not simply copying
program source code illegally from proprietary programs.
-
Does OSS/FS expose you to greater risk of abandonment? No.
Businesses go out of business, and individuals lose interest in products,
in both the proprietary and OSS/FS world.
A major difference, however, is that all OSS/FS programs are automatically
in escrow - that is, if their original developer stops supporting the
product, any person or group can step forward to support it instead.
This has been repeatedly demonstrated in OSS/FS.
For example, the
GIMP is a bitmapped graphical editor that was abandoned by its
original developers (what’s worse, they abandoned it
before its initial release and failed to arrange for anyone else
to succeed them).
Nevertheless, even in this worst-case situation, after a period of time
other users came forward and continued its development.
As another example,
NCSA abandoned its web server “httpd”, so some of its users banded
together to maintain it - its results became Apache, the world’s most popular
web server.
- Are OSS/FS licenses enforceable? In particular, is the GPL enforceable?
Almost all OSS/FS programs are released under some sort of license, and
the most popular license is the GPL.
A few competitors have claimed, in the past, that these licenses -- in
particular the GPL -- are unenforceable.
But legal scholars and lawyers who look into the issue generally
scoff at such arguments.
Eben Moglen
(professor of law at Columbia University Law School and general counsel
of the Free Software Foundation)
wrote an article titled
Enforcing the GNU GPL, where he describes why the GPL
is so easy to enforce --
and why he’s been able to enforce the GPL dozens of times without
even going to court.
At the time, he stated that
“We do not find ourselves taking the GPL to court because
no one has yet been willing to risk contesting it with us there.”
Eben Moglen also gave a
keynote address at the University of Maine Law School’s Fourth Annual
Technology and Law Conference, Portland, Maine, June 29, 2003, where he
explains why it’s so easy to enforce the GPL.
He explains it this way:
“because of the structure of my license, the defendant’s obligation
[is] affirmatively to plead it, if she wants to.
After all, if she is distributing, it is either without license,
in which case my license doesn’t get tested -- there’s an unlicensed
distribution going on and it’s enjoinable -- or the license is
pled by the other side .... how interesting...
For ten years, I did all of the GPL enforcement work around
the world by myself, while teaching full time at a law school.
It wasn’t hard, really; the defendant in court would have had no license,
or had to choose affirmatively to plead my license:
they didn’t choose that route.
Indeed, they didn’t choose to go to court; they cooperated,
that was the better way... We got compliance all the time.”
In 2004, the GPL was finally tested in court and found valid.
On 14 April 2004, a three-judge panel in German Munich court
granted a preliminary injunction to stop distribution
of a Sitecom product that was derived from the GPL, yet failed to comply
with the GPL.
(see also the French article
La licence GPL sur un logiciel libre n’est pas une demi-licence!).
Soon afterwords, Sitecom Chief Executive Pim Schoenenberger
said the company made changes to comply with the GPL.
The preliminary injunction was later
confirmed on July 23, 2004,
along with a significant judgement.
John Ferrell of law firm Carr & Ferrell
declared that this German decision lends weight to the GPL, and that it
“reinforces the essential obligations of the GPL by requiring that
if you adopt and distribute GPL code, you must include
the GPL license terms and provide source code to users,” just
as its license requires.
In the U.S., the case
Drew Technologies, Inc. v. Society of Automotive Engineers, Inc. (SAE)
(Civil Action No. 03-CV-74535 DT, U.S. District Court,
Eastern District of Michigan)
involved GPL software.
A 2005 settlement left intact a GPL program’s software license.
While not as clear a judgement for the GPL as above, the judge clearly
took the license seriously, and did not allow the license to simply be
nullified.
The license requirements for common OSS/FS licenses are actually
easy to comply with, but there is significant evidence that those
terms are enforceable.
Which is good news for OSS/FS users; clear, simple, and consistent
requirements make it easy to understand what to do.
For developers who depend on licenses like the GPL to keep the
code available for improvement, this is also good news.
-
Are there special legal rules about incorporating OSS/FS into my
programs? No, fundamentally the same rules apply whether you
incorporate proprietary or open source software into your program.
Fundamentally, you may only include software developed by someone else
into your software if you have a license that permits you to do so, and
you must follow the requirements of that license.
For most proprietary programs, this can only be done by paying
per-unit royalty fees and/or limiting your use (such as only using it for
educational purposes).
If you fail to obey those rules, you can be taken to court for damages,
regardless of whether it’s proprietary or OSS/FS.
Many proprietary programs include open source software, so it’s
obviously possible to do this legally.
Microsoft Windows includes OSS/FS components
(such as components from the University of California, Berkeley and its contributors
which implement Internet-related capabilities),
as does Microsoft Office
(it uses zlib).
However, just as with proprietary software, you must examine the
license first before you reuse someone else’s software.
Some OSS/FS programs have use licenses such as BSD, MIT, and similar that
explicitly permit you to reuse software in your system
without any royalty fees as long as you follow some simple rules.
However, you still have to follow rules, for example, some
require some sort of credit in the documentation or code itself.
These are very low-cost requirements, and meeting them is far cheaper
than writing the software yourself!
The most common OSS/FS license is the GPL, which allows you to
use the software in arbitrary ways.
However, the GPL strictly limits how you’re allowed
to combine the software
with proprietary software (it does prohibit certain actions).
The GPL also requires release of the source code
to the recipients of the binary.
We’ll discuss the GPL more in the next point.
Karen Faulds Copenhaver of Black Duck Software’s
“Reviewing Use of OSS in the Enterprise”
discusses various myths, including the once-common myth that
“You cannot use open source software in a proprietary environment”.
Instead, she notes that from a developer’s
perspective, OSS/FS and proprietary code have essentially the same issues:
you must understand and fulfill your license obligations,
Indeed, she believes that OSS/FS compliance will generally be must easier,
and that the risk of enforcement is far higher from proprietary
code though the same remedies apply (see slide 18).
Thus, by slide 19 she notes that
organizations developing software of any kind (whether or not
the software uses OSS/FS components) must know what code is in the code base,
must know the obligations of all licensed materials used
(so they can fulfill them), and
must know whether or not the license obligations
of the various components are compatible.
They note that organizations who are developing software
should embrace OSS/FS (slide 36), but when they do,
they should meet the obligations of them.
Sometimes these licenses will be a deciding factor.
For example, there are two common GUI toolkits on Linux-based systems:
Gtk+ and Qt.
Gtk+ is released under the LGPL license, and thus can be used by both
OSS/FS and proprietary programs without any royalty payments.
Qt is available freely under a GPL license, and for a royalty fee under
a proprietary license.
If you didn’t want to make a royalty payment to Qt’s developers
(and/or are concerned about potential future payments and/or how that
might empower one company in the future), you
could choose to use the Gtk+ library.
On the other hand, if you’re determined to illegally
violate the licenses,
then do not make the unwise presumption that you won’t get caught.
Since OSS/FS source code is widely available, it turns out
that it’s often easy to determine if a product has stolen code, and
people do actually do such analysis.
One developer quickly found and proved that “CherryOS”
had blatantly stolen PearPC Code.
Netfilter developers have had
many successes in enforcing their licenses against
people who sell black-box routers and wireless access points with
stolen code.
The site
GPL-violations.org
has the
goal to resolve GPL violations, amicably where possible,
and the
Free Software
Foundation (FSF)’s Compliance lab handles investigation of alleged violations
of the GPL and LGPL and subsequent enforcement
when violations are confirmed.
Besides being sued by an original developer (for stealing their work),
you also won’t be able to sue others if they steal your work, due to
legal doctrine called “unclean hands”;
If someone has stolen something from you, but you stole to
acquire it in the first place, courts will tend to throw you out.
The bottom line: if you
intend to reuse someone else’s software in your own, you must
always examine the license first before incorporating it into
your system (to make sure its requirements are compatible with yours).
This is true whether the code is proprietary or OSS/FS.
Development organizations normally have a process for evaluating
licenses, so the task of evaluating an OSS/FS license is just more
of the same work they already have to do.
If you’re developing proprietary code, just make sure that your developers
are legally obligated to go through a vetting process before reusing
external code (this is standard practice in the industry).
OSS/FS licenses generally require that the license accompany the code
it covers, so it’s quite easy to get and review any license
(it comes with the code you want to use!).
If there’s any doubt, there are search engines you can use to check.
But this licensing decision
is the same sort of decision that must already be made in
any software development shop: before reusing code, you must ensure that
its licensing requirements are compatible with your requirements, and
that you comply with its requirements.
-
Will unintentionally including GPL code in proprietary code force
the rest of the product to be GPL’ed? No, though you can choose to do
so.
The GPL, like most licenses for proprietary software libraries,
grants you the right to use code only under certain conditions.
Many proprietary libraries require that you pay a fee for each copy,
or a large fee for unlimited use.
The GPL requires no fee, and indeed doesn’t include many of the restrictions
a typical proprietary software license includes.
But the GPL does require that, if you include the GPL
code as part of your code, you need to release the rest of the code under
the GPL.
So what happens if you are developing a proprietary product, and one of
your developers includes GPL code directly into the product without your
knowledge?
Once that happens, you typically have three options:
(1) release the rest under the GPL, (2) remove the GPL’ed code, or
(3) arrange for the GPL’ed code to be released to you under a compatible
license (this typically involves a fee, and some projects will not
be willing to do this).
This is not a good situation to be in; make sure that your developers
know that they must not steal code from any source, but must instead
ensure that the licenses of any software they include in your program
(either open source software or proprietary software) is compatible
with your licenses.
Note that exactly the same thing happens if you incorporate someone
else’s proprietary code in your software, with typically even worse results,
because proprietary vendors are more likely to sue without working with
you and they can often show larger direct monetary losses.
There are many ways of proprietary and GPL programs can work
together, but it must be carefully done to obey the licenses.
The Linux kernel is GPL’ed, but proprietary applications can run on
top of it (outside the kernel) without any limitations at all.
The gcc compiler is GPL’ed, but proprietary applications can be compiled
using it.
A GPL program can be invoked by a proprietary program, as long as they
are clearly separable.
Indeed, there are a large number of misconceptions about the GPL,
more than can be covered here.
For more information about the GPL, a useful source is the
Frequently Asked Questions about the GNU GPL
from the Free Software Foundation (the authors of the GPL).
-
Is OSS/FS economically viable? Yes.
There are companies that are making money on OSS/FS, or using OSS/FS
to support their money-making activities.
Many papers have been written about how to make money using OSS/FS, such as
Eric S. Raymond’s “The Magic Cauldron” and
Donald K. Rosenberg’s “How to make money
with open-source software.”
The
IT Manager’s Journal article from May 2004
by John C. Koenig
describes “Seven open source business strategies for competitive advantage”
(i.e., seven business strategies using open source software).
Bruce Perens’ “The Emerging Economic Paradigm of Open Source”
also provides useful insights.
OSS/FS isn’t compatible with some business models,
but OSS/FS is certainly compatible with or supports other models.
Capitalism does not
guarantee that businesses can remain unchanged in changing environments.
For example,
HP reported in January 2003 that it had annual sales
of $2 billion linked to GNU/Linux.
IBM reported in 2002
that they had already made almost all of their $1 billion investment
in Linux back in only one year - i.e., as profit.
James Boyle’s response “Give me liberty and give me death?”
makes the extraordinary observation that
“IBM now earns more from what it calls ‘Linux-related revenues’
than it does from traditional patent licensing,
and IBM is the largest patent holder in the world.”
The 2004 article
“Firefox fortune hunters”
notes that “new businesses are cropping up to provide
organizations ranging from museums to software companies
to the U.S. Department of Defense with Mozilla-based applications --
for a fee.”
“Business is pretty crazy right now,” said Pete Collins of the
Mozdev Group, “With the popularity of Firefox and the economy rebounding,
we’ve been swamped. We don’t even advertise--clients find us
and provide us with work.”
The
Financial Times Story “Could Linux dethrone the software king?” from
January 21, 2003 analyzes some of the financial issues of OSS/FS.
Joel Spolsky’s “Strategy Letter V” notes that
“most of the companies spending big money to develop open source software
are doing it because it’s a good business strategy for them.”
His argument is based on microeconomics, in particular, that
every product in the marketplace has substitutes and complements.
A substitute is another product you might buy if the first product
is too costly, while
a complement is a product that you usually buy together with another product.
Since demand for a product increases when the prices
of its complements decrease,
smart companies try to commoditize their products’ complements.
For example, an automobile manufacturer may invest to reduce the cost of
gas refinement - because if gas is cheaper, they’ll sell more cars.
For many companies,
such as computer hardware makers and service organizations,
supporting an OSS/FS product turns a complementary
product into a commodity - resulting in more sales (and money) for them.
Although many OSS/FS projects originally started with an individual working
in their spare time, and there are many OSS/FS projects which can still
be described that way,
the “major” widely-used projects tend to no longer work that way.
Instead, most major OSS/FS projects have large corporate backing with
significant funds applied to them.
This shift has been noted for years, and is discussed in papers such as
Brian Elliott Finley’s paper Corporate Open Source Collaboration?.
Also, looking only at companies making money from OSS/FS misses
critical issues, because that analysis
looks only at the supply side and not the demand side.
Consumers are saving lots of money and gaining many other benefits
by using OSS/FS, so there is a strong economic basis for its success.
Anyone who is saving money will fight to keep the savings, and
it’s often cheaper
for consumers to work together to pay for small improvements in an OSS/FS
product than to keep paying and re-paying for a proprietary product.
A proprietary vendor may have trouble competing with a similar OSS/FS
product, because the OSS/FS product is probably much cheaper and frees
the user from control by the vendor.
For many, money is still involved - but it’s money saved, not money
directly acquired as profit.
Some OSS/FS vendors have done poorly financially - but many
proprietary software vendors (and restaurants!) have also done poorly too,
and that doesn’t mean that OSS/FS never works.
Luckily for consumers, OSS/FS products are not tied
to a particular vendor’s financial situation as much
as proprietary products are.
Fundamentally, software is economically different than physical goods;
it is infinitely replicable, it costs essentially nothing to reproduce,
and it can be developed by thousands of programmers working together
with little investment
(driving the per-person development costs down to very small amounts).
It is also durable (in theory, it can be used forever) and nonrival
(users can use the same software without interfering with each other,
a situation not true of physical property).
Thus, the marginal cost of deploying a copy of a software package quickly
approaches zero.
This explains how Microsoft got so rich so
quickly (by selling a product that costs nearly nothing to replicate),
and why many OSS/FS developers can afford to give software away.
See
“Open Source-onomics:
Examining some pseudo-economic arguments about Open Source”
by Ganesh Prasad, which counters “several myths about the economics
of Open Source.”
People
are already experimenting with applying OSS/FS concepts to other
intellectual works, and it isn’t known how well OSS/FS concepts will
apply to other fields.
Yochai Benkler’s 2002 Yale Law Journal article,
“Coase’s Penguin, or Linux and the Nature of the Firm”
argues that OSS/FS development is only one example of the broader
emergence of a new, third mode of production in
the digitally networked environment called
“commons-based peer-production”
(to distinguish it from the property- and contract-based models
of firms and markets).
He states that its central characteristic is that groups of individuals
successfully collaborate on large-scale projects following a diverse
cluster of motivational drives and social signals, rather than
either market prices or managerial commands.
He also argues that this
mode has systematic advantages over markets and managerial hierarchies
when the object of production is information or culture,
and where the capital investment necessary for production
(computers and communications capabilities) is widely distributed
instead of concentrated.
These advantages are that
(1) it is better at identifying and assigning human capital to
information and cultural production processes
(a smaller “information opportunity cost” in assigning the best person
for a given job), and
(2) there are substantial increasing returns to allow
larger clusters of potential contributors to interact
with very large clusters of information resources in search of new projects
and collaboration enterprises
(because property and contract constraints have been removed).
In short, it is clear that making economic decisions
based on analogies between software and physical objects
is not sensible, because software has many economic
characteristics that are different from physical objects.
-
Will OSS/FS destroy the software industry?
Won’t programmers starve if many programs become OSS/FS? No; increasingly OSS/FS is commercially developed and supported.
It’s certainly possible that many OSS/FS products will eliminate their
proprietary competition, but that’s the nature of competition.
If OSS/FS approaches pose a significant threat to proprietary development
approaches, then proprietary vendors must either find ways to compete
or join the OSS/FS movement.
No one mourns the loss of buggy whip manufacturers, who were driven
out of business by a superior approach to transportation (cars).
Heinlein noted that no one is guaranteed protection against
change in Life-Line (1939):
“There has grown up in the minds of certain groups in this country
the notion that because a man or a corporation has made a profit out
of the public for a number of years, the government and the courts
are charged with the duty of guaranteeing such profit in the future,
even in the face of changing circumstances and contrary public
interest. This strange doctrine is not supported by statute nor
common law. Neither individuals nor corporations have any right to
come into court and ask that the clock of history be stopped, or
turned back, for their private benefit. “
Eric Raymond’s
“The Magic Cauldron” describes many ways to make money
with OSS/FS.
One particularly interesting note is that there is evidence that 95%
of all software is not developed for sale.
For the vast majority of software,
organizations must pay developers to create it anyway.
Thus, even if OSS/FS eliminated all shrink-wrapped programs,
it would only eliminate 5% of the existing software development jobs.
And, since the OSS/FS programs would be less expensive, other tasks could
employ developers that are currently too expensive, so widespread OSS/FS
development would not harm the ability of developers to make a living.
The Open Source Initiative has an article on why programmers won’t starve,
and again,
Bruce Perens’ “The Emerging Economic Paradigm of Open Source”
also provides useful insights.
OSS/FS doesn’t require that software developers work for free;
many OSS/FS products are developed or improved by employees
(whose job is to do so) and/or by contract work
(who contract to make specific improvements in OSS/FS products).
If an organization must have a new capability added to an OSS/FS program,
they must find someone to add it... and generally, that will mean
paying a developer to develop the addition.
That person may be internal to the organization, someone already
involved in the program being modified, or a third party.
The difference is that, in this model, the cost is paid for development of
those specific changes to the software,
and not for making copies of the software.
Since copying bits is essentially a zero-cost operation today, this means
that this model of payment more accurately reflects the actual costs
(since in software almost all costs are in development, not in copying).
There are several different systems for connecting people willing to
pay for a change with people who know how to make the change.
A common approach is to use your own employees to make the change
necessary for what you want.
But there are alternatives.
Bounty systems (also called sponsor systems
or pledge systems)
are systems where a user asks for an improvement and states a price they’re
willing to pay for that improvement.
Typical bounty systems allow others to
join in, with the goal of accumulating enough of a bounty to
entice a developer to implement the improvement.
Some bounty systems are run by individual projects; others are
third-party bounty systems that work like independent auction houses,
connecting users with third-party developers.
Many OSS/FS projects run their own bounty systems, such as the
Mozilla projects, the
GNOME project, and
Horde.
This is sometimes directly supported by the project’s tools;
the Mantis
bug tracking system includes a
sponsorship option, so that
every time you report a bug or feature request,
you can include an amount you’re willing to pay for it.
That means that any project that uses the Mantis bug tracker
(including projects like Plucker)
automatically includes a bounty system.
I expect that
more bug/improvement tracking systems will include this capability in
the future, since it easily integrates into the existing project
processes, and it supports direct interaction between users and developers.
Some users and governments offer a bounty from their own sites that
describe what they want;
Mark Shuttleworth’s
bounties are good example.
There are also organizations that support third-party bounties or
group fundraising activities, such as
Ideacradle.com and
dropcash.com.
Somewhat confusingly, the term “security bug bounty system” is often used
for the system where anyone who reports a security defect is paid a
certain amount;
projects like
Mozilla have security bug bounty programs.
Another approach, primarily used when trying to transform a proprietary
software into an OSS/FS program (by buying the software from its previous
owner) has been called a “software ransom”; users pool their
money together with the purpose of paying the owner to release the
product as OSS/FS.
For example,
Blender was
released as OSS/FS through a software ransom
(termed the “Free Blender” campaign).
Indeed, there has been a recent shift in OSS/FS away from volunteer
programmers and towards paid development by experienced developers.
Again, see
Ganesh Prasad’s article
for more information.
Brian Elliott Finley’s article
“Corporate Open Source Collaboration?” stated that
“Now corporate America is getting involved in the development process.
This seems to be a common trend amongst individuals,
and now corporations, as they move into the Open Source world.
That is that they start out as a user, but when their needs
outstrip existing software, they migrate from being mere users
to being developers. This is a good thing, but it makes
for a slightly different slant on some of the dynamics of the process.”
AOL decided
to spin off the Mozilla project as a separate organization;
not only does the separate organization employ several full-time
employees, but other organizations have worked to hire Mozilla workers.
Fundamentally, paying sotware developers is similar to paying for
proprietary licenses, except you only have to pay for improvements
(instead of paying for each copy), so many organizations appear to have
found that it’s worthwhile.
The Boston Consulting Group/OSDN
Hacker Survey (January 31, 2002) surveyed users of SourceForge
and found that 33.8% of the OSS/FS developers
were writing OSS code for “work functionality”
(i.e., it was something they did as part of their employment).
It also provided quantitative evidence that OSS/FS developers are experienced;
it found that OSS/FS developers had an average age of 30 and that they
averaged 11 years of programming experience.
In 2004,
Government Computer News reported in July 2004
on a presentation by Andrew Morton, who leads maintenance of the
the Linux kernel in its stable form, and confirmed the trend
towards paid OSS/FS developers.
Morton spoke at a meeting sponsored by the Forum on Technology and Innovation,
to address technology-related issues, held by
Sen. John Ensign (R-Nev.), Sen. Ron Wyden (D- Ore.)
and the Council on Competitiveness.
Morton noted that “People’s stereotype [of the typical Linux developer]
is of a male computer geek working in his basement writing
code in his spare time, purely for the love of his craft.
Such people were a significant force up until about five years ago ...”
but contributions from such enthusiasts, “is waning...
Instead, most Linux kernel code is now generated by corporate programmers.”
Morton noted that
“About 1,000 developers contribute changes to Linux
on a regular basis... Of those 1,000 developers,
about 100 are paid to work on Linux by their employers.
And those 100 have contributed about 37,000 of the last 38,000
changes made to the operating system.”
The article later notes
“Even though anyone can submit changes, rarely does good
code come from just anyone. Morton noted that it is rare
that a significant change would be submitted from someone
who is completely unknown to the core developers.
And all submitted code is inspected by other members of the group,
so it is unlikely some malicious function may be secretly embedded in Linux...
Far from being a project with a vast numbers of contributors,
about half of those 37,000 changes are made by core developer team
of about 20 individuals, Morton said.”
The September 3, 2004 article
Peace, love and paychecks
gives one of many examples of this trend.
Network Appliance (NetApp) pays significant money to one of the
Linux lieutenants (Myklebust), as well as developing code for Linux,
for a very simple reason: money.
“What’s in it for [NetApp] is sales; it can sell into the Linux market.
This is not about philanthropy.
There is plenty of mutual benefit going on here,” says Peter Honeyman.
The article notes that
“Big companies pick up the tab for Linux development
because the system helps them sell hardware and consulting services.
HP claims $2.5 billion in Linux-related revenue in 2003,
while IBM claims $2 billion.
Red Hat, which distributes a version of the Linux operating system,
generated $125 million in revenues last fiscal year
and carries a market value of $2.3 billion.
Last year sales of Linux servers grew 48% to $3.3 billion,
and by 2008 Linux server sales could approach $10 billion,
according to market researcher IDC.”
NetApp earned $152 million on sales of $1.2 billion,
its Linux payoff is significant.
Linux now contains bits of code written by NetApp’s programmers,
so that NetApp works particularly well with Linux.
As a result, “it has won business it wouldn’t have otherwise
at Oracle, Pixar, Southwest Airlines, ConocoPhillips and
Weta Digital, the effects studio behind Lord of the Rings.”
For fast-moving projects like the Linux kernel, the entire development
process is supportive of developers of kernel improvements and
drivers who contribute to the codebase... and not to those who try to
rig the system and make proprietary kernel drivers (proprietary applications
are fine).
One person noted,
“the kernel developers all like how this [development process] is working.
No stable internal-kernel [application programmer interface],
never going to happen, get used to it (syscalls won’t break).”
Drivers outside of the official Linux kernel tree will
typically become useless almost immediately;
thus, developers must get their device drivers released as OSS/FS and
into the main kernel immediately,
or the development process will rush away from you.
Proprietary components are treated as if they don’t exist, and
if you don’t support the community, people generally don’t care.
Organizations who try to acquire ownership of the kernel
through licensing games quickly discover that their efforts are discarded.
BusinessWeek ran a lengthy cover story on January 2005
called “Linux Inc.” which described the whole GNU/Linux development
process, and related business models, in detail.
Walt Scacchi, a research scientist at the University of California
at Irvine’s Institute for Software Research, studies the
OSS/FS, and found that salaries are 5-15% higher for core contributors
to popular OSS/FS projects.
The article
Firefox fortune hunters quotes Scacchi, who explained that
“These people are in demand...
software developers who are identified as core contributors
[to popular OSS/FS projects] are
likely to have market opportunities that conventional software developers
would not have.
If you’ve contributed to a software system used by millions of people,
you’ve demonstrated something that most software developers have not done.”
Robert Westervelt reported in SearchVB
(a resource specializing in Microsoft’s Visual Basic!) reported that
security, web services and Linux jobs continue to dominate the IT
help wanted ads in 2004, and are projected to remain
among the hottest skill and certification areas in 2005.
Tony Iams, principal analyst with D.H. Brown Associates Inc., said that
“Linux for a long time had been targeted for edge of
network type applications, but it’s taking on support for a
much broader range of applications... For a while, it looked like the
future was Windows, but now there is a larger demand for a more hands-on
understanding for the Unix and Linux philosophy of managing workloads.”
The
Free Software Foundation (FSF)’s
Jobs in Free Software page is one of many places where companies and
potential employees can find each other to work on OSS/FS projects,
but it certainly not the only such place.
Corporate support of OSS/FS projects is not a new phenomenon.
The X window system began in 1984 as a cooperative effort between MIT and
Digital Equipment Corporation (DEC), and by 1988 a non-profit vendor
consortium had been established to support it.
The Apache web server
began in 1995,
based on previous NCSA work.
In other words,
both X and Apache were developed and maintained
by consortias of companies from their very beginning.
Other popular OSS/FS projects like MySQL, Zope, and Qt
have had strong backing from a specific commercial company for years.
But now there is more corporate acceptance in using OSS/FS processes
to gain results, and more understanding of how to do so.
And as more OSS/FS projects gain in maturity, it is more likely that
some project will intersect with a given company’s needs.
It seems unlikely that so many developers would choose to support an approach
that would destroy their own industry, and
there are a large number of OSS/FS developers.
On January 28, 2003, Sourceforge.net all by itself reported that it had
555,314 registered users on its OSS/FS development site, and many of the
largest OSS/FS projects are not hosted by
Sourceforge.net (including the Linux kernel, the gcc compilation
system, the X-Windows GUI system, the Apache web server,
the Mozilla web browser, and the OpenOffice.org document management suite).
Unfortunately, there seems to be no data to determine the number of OSS/FS
developers worldwide, but it is likely to be at least
a million people and possibly many, many more.
OSS/FS enables inexperienced developers to gain experience and
credibility, while enabling organizations to find the
developers they need (and will then pay to develop more software).
Often organizations will find the developers they need by
looking at the OSS/FS projects they depend on (or on related projects).
Thus, lead developers of an OSS/FS project
are more likely to be hired by organizations when those
organizations need an extension or support for that project’s program.
This gives both hope and incentive to inexperienced developers; if they
start a new project, or visibly contribute to a project, they’re more
likely to be hired to do additional work.
Other developers can more easily evaluate that developer’s work
(since the code is available for all to see), and the
inexperienced developer gains experience
by interacting with other developers.
This isn’t just speculation; one of Netscape’s presenters at FOSDEM 2002
was originally a volunteer contributor to Netscape’s Mozilla project; his
contributions led Netscape to offer him a job (which he accepted).
Of course, OSS/FS certainly has an impact on the software industry,
but in many ways it appears quite positive, especially for customers.
Since customers are the ones directly funding the specific improvements
they actually want (using money and/or developer time),
market forces push OSS/FS developers directly towards making
the improvements users actually want.
Proprietary vendors try to identify customer needs
using marketing departments, but there’s little evidence that
marketing departments are as effective as customers themselves at
identifying customer needs.
In OSS/FS development, customers
demonstrate which capabilities are most important to them, directly, by
determining what they’ll fund.
Another contrast is that proprietary developers’ funding motivations
are not always aligned with customers’ motivations.
Proprietary development has strong financial incentives
to prevent the use of competing products,
to prevent interoperation with competing products, and to
prevent access to copies (unless specifically authorized by the vendor).
Thus, once a proprietary product becomes widely used,
its vendor sometimes devotes increasing efforts to prevent use,
interoperation, and copying,
instead of improving capabilities actually desired by customers and
even if those mechanisms interfere with customer needs.
This trend is obvious over the decades of the software industry;
dongles, undocumented and constantly changing data protocols and data formats,
copy-protected media, and software registration mechanisms which
interfere with customer needs are all symptoms of this
difference in motivation.
Note that an OSS/FS developer loses nothing if their customer later
switches to a competing product (whether OSS/FS or proprietary), so
an OSS/FS developer has no incentive to insert such mechanisms.
And many companies have been created to exploit OSS/FS.
No doubt many will fail, just like many restaurants fail, but those
who suceed should do well.
The Star Tribune
notes that starting a software company used to be hard work -- now
people take OSS/FS products, combine them to solve specific problems,
and sell them (with support) at a large profit.
Karen Shaeffer has written an interesting piece,
Prospering
in the Open Source Software Era,
which discusses what she views to be the effects of OSS/FS.
For example,
OSS/FS has the disruptive effect of commoditizing what used to be proprietary
property and it invites innovation (as compared to proprietary software
which constrained creativity).
She thinks the big winners will be end users and the software developers,
because
“the value of software no longer resides in the code base - it
resides in the developers who can quickly adapt and extend
the existing open source code to enable businesses to
realize their objectives concerned with emerging opportunities.
This commoditization of source code represents a quantum step forward
in business process efficiency - bringing the developers
with the expertise into the business groups
who have the innovating ideas.”
-
Is OSS/FS compatible with Capitalism? Yes.
Years ago some tried to label OSS/FS as “communistic”
or “socialistic” (i.e., anti-capitalist), but that rhetoric has failed.
One article explaining why OSS/FS and capitalism are compatible is
Ganesh Prasad’s
How Does the Capitalist View Open Source?.
This paper shows that OSS/FS is quite consistent with capitalism: it
increases wealth without violating principles of property ownership
or free will.
The developer of the Linux kernel,
Linus Torvalds,
noted that U.S. copyright law specifically notes the exchange of
copyrighted material as financial gain.
US Code, Title 17 (copyrights), Chapter 1, Section 101: “Definitions”
says that,
“The term ‘financial gain’ includes receipt, or expectation of receipt,
of anything of value, including the receipt of other copyrighted works.”
He notes that this is part of the very fundamentals of copyright law.
What’s more, he notes that the GPL license
(the most popular OSS/FS license)
“is designed so that people receive the value of other people’s
copyrighted works in return [for] their own contributions.
That is the fundamental idea of the whole license -
everything else is just legal fluff...
the notion that the GPL has, of
‘exchange of receipt of copyrighted works,’
is actually explicitly encoded in U.S. copyright law.
It’s not just a crazy idea that some lefty Commie hippie dreamed up...”
See also the information on
economic viability and
starving programmers for more.
-
If only OSS/FS programs exist in a software category, will
that completely eliminate competition? No.
Oddly enough, OSS/FS programs sometimes compete with each other in
a given functional area.
The text editors emacs (primarily GNU emacs) and vi
(primarily vim) have dueled for decades.
Sendmail is still a popular program for delivering email, but it
has competition from other OSS/FS programs such as Postfix and Exim.
The desktop environments GNOME and KDE compete with each other, as
do the OS kernels of Linux and the BSDs.
Generally, competing OSS/FS projects must distinguish themselves
from each other to succeed (e.g., through user interface philosophies,
design approaches, characteristics like security,
licensing strategies, and so on),
but of course that’s true for competing proprietary programs too.
Also, competing OSS/FS programs generally
try to stay compatible with each other (because their customers
demand it) and sometimes even help each other with technical problems.
For example,
freedesktop.org provides a forum
to encourage cooperation among open source desktops for the X Window System
(such as KDE and GNOME),
and is part of the
Free Standards Group
which tries to accelerate the use and acceptance of
open source technologies through the development,
application and promotion of standards.
In addition, even if there is one product, multiple organizations
can compete for maintenance and support (e.g., GNU/Linux distributors
do this).
Thus, even if OSS/FS eliminates all proprietary
programs in a given category, that would still not eliminate competition.
-
Are OSS/FS program compatible with standards? Yes.
OSS/FS programs can implement standards, just like proprietary programs can.
OSS/FS often implement relevant standards better than proprietary products.
The reason is simple: OSS/FS projects have no financial incentive
to ignore or subvert a standard.
A proprietary software maker’s duty is to maximize profits.
Proprietary makes may choose to do this by ignoring standards
or creating proprietary extensions to standards;
once customers depend on these proprietary interfaces, they will find it
very difficult to switch to a different product, even if it’s better.
In contrast, OSS/FS projects are generally supported directly by their
users, who want to employ standards to maintain access to their
data, simplify interoperation with others, and simplify integration
into their own environments.
I have sometimes noted that OSS/FS projects often end up creating
executable specifications or executable standards.
Traditional (paper) standards cannot be directly used by users, and
always include ambiguities that are difficult to resolve later.
In contrast, OSS/FS programs can be used directly be users --
thus they help users more directly -- yet because their implementations
are transparent, they can clarify any ambiguities in the documented standards.
As OSS/FS has grown, various bodies have worked to develop standards
to support interoperability.
This includes
the Free Standards Group,
Free Desktop.org,
Linux Standard Base,
the Filesystem Hierarchy Standard,
and
X.org.
There is also a great deal of interaction with standards-making
groups such as the IETF and the
W3C.
See also my discussion on
single source solutions.
-
Is OSS/FS a “destroyer of intellectual property”? No.
It’s true that
Microsoft’s Jim Allchin has claimed that OSS is an
intellectual-property destroyer and that it’s somehow “un-American”.
But you can use OSS/FS products (e.g., a word processor)
to develop private and proprietary information, and you can keep
the information as confidential and proprietary as you want.
What you can’t do is use someone else’s material in
a way forbidden by law... and this is true for all software, not just OSS/FS.
One interesting case is the “General Public License” (GPL),
the most common OSS/FS license.
Software covered by the GPL can be modified, and the modified code can
be used in house without obligations.
If you release that modified software, you
must include an offer for the source code under the same GPL license.
Basically, the GPL creates a consortium; anyone can use and
modify the program, but anyone who releases the program (modified or not)
must satisfy the restrictions in the GPL that prevent the program
and its derivatives from becoming proprietary.
Since the GPL is a legal document, it can be hard for some to understand.
Here is one less legal summary
(posted on Slashdot):
This software contains the intellectual property of several people.
Intellectual property is a valuable resource, and you cannot expect
to be able to use someone else’s intellectual property
in your own work for free.
Many businesses and individuals are willing to
trade their intellectual property in exchange for something of value;
usually money. For example, in return for a sum of money,
you might be granted the right to incorporate code from someone’s
software program into your own.
The developers of this software are willing to trade you the right
to use their intellectual property in exchange for something of value.
However, instead of money, the developers are willing to trade
you the right to freely incorporate their code into your software
in exchange for the right to freely incorporate your code
[which incorporates their code] into theirs.
This exchange is to be done by way of and under the terms of the GPL.
If you do not think that this is a fair bargain,
you are free to decline and to develop your own code or purchase
it from someone else.
You will still be allowed to use the software,
which is awfully nice of the developers, since you probably didn’t pay
them a penny for it in the first place.
Microsoft complains that the GPL does not allow them to take such code
and make changes that it can keep proprietary, but this is hypocritical.
Microsoft doesn’t normally allow others to make and distribute changes to
Microsoft software at all,
so the GPL grants far more rights to customers than Microsoft does.
In some cases Microsoft will release source code under its
“shared source” license, but that license (which is not OSS/FS)
is far more restrictive.
For example, it prohibits
distributing software in source or object form
for commercial purposes under any circumstances.
Examining Microsoft’s shared source license also shows that it
has even more stringent restrictions on intellectual property rights.
For example, it states that “if you sue anyone over patents that you think may
apply to the Software for a person’s use of the Software,
your license to the Software ends automatically,” and
“the patent rights Microsoft is licensing only apply
to the Software, not to any derivatives you make.”
A longer analysis of this license and the problems
it causes developers is provided by Bernhard Rosenkraenzer (bero).
The FSF has also posted a press release on why they believe
the GPL protects
software freedoms.
It’s true that organizations that modify and release
GPL’ed software must yield any
patent and copyright rights for those additions they release, but
such organizations do so voluntarily (no one can force anyone
to modify GPL code) and with full knowledge (all GPL’ed software comes
with a license clearly stating this).
And such grants only apply to those modifications;
organizations can hold other unrelated rights if they wish to do so,
or develop their own software instead.
Since organizations can’t make such changes at all to proprietary software
in most circumstances, and generally can’t redistribute changes in the few
cases where they can make changes,
this is a fair exchange, and organizations get far more rights with the GPL
than with proprietary licenses (including the “shared source” license).
If organizations don’t like the GPL license,
they can always create their own code,
which was the only option even before GPL’ed code became available.
Although the GPL
is sometimes called a “virus” by proprietary vendors
(particularly by Microsoft)
due to the way it encourages others to also use the GPL license,
it’s only fair to note that
many proprietary products and licenses
also have virus-like effects.
Many proprietary products with proprietary data formats or protocols
have “network effects,” that is,
once many users begin to use that product, that group
puts others who don’t use the same product at a disadvantage.
For example, once some users pick a particular product
such as a proprietary OS or
word processor, it becomes increasingly
difficult for other users to use a different product.
Over time this enforced use of a particular proprietary product
also spreads like a virus.
Certainly many technologists and companies don’t think
that the GPL will destroy their businesses.
Many seem too busy mocking Microsoft’s claims instead
(for an example, see
John Lettice’s June 2001 article “ Gates: GPL will eat your economy,
but BSD’s cool”).
After all,
Microsoft sells a product with GPL’ed components, and
still manages to hold intellectual property (see below).
Perhaps Microsoft means the GPL “destroys” intellectual property
because the owners of competing software may be driven out of business.
If so, this is hypocritical; Microsoft has driven many companies out
of business, or bought them up at fractions of their original price.
Indeed, sometimes the techniques that Microsoft used have
later been proven in court to be illegal.
In contrast, there is excellent evidence that
the GPL
is on very solid legal ground.
“Destruction” of one organization by another
through legal competition is quite normal in capitalistic economies.
The GPL does not “destroy” intellectual property; instead, it creates
a level playing field where people can contribute improvements voluntarily
to a common project without having them “stolen” by others.
You could think of the GPL as creating a consortium; no one is
required to aid the consortium, but those who do must play by its rules.
The various motivations for joining the consortium vary considerably
(see the article
License to FUD), but that’s true for any other consortium too.
It’s understandable that Microsoft would want to take this consortium’s
results and take sole ownership of derivative works,
but there’s no reason to believe that a world where the GPL cannot be used
is really in consumers’ best interests.
The argument is even more specious for non-GPL’ed code.
Microsoft at one time protested about open source software, but
indeed, they are a key user of open source software;
key portions of Microsoft Windows (including much of their Internet interfacing
software) and Microsoft Office (such as compression routines) include
open source software.
In 2004,
Microsoft released an installation tool, WiX, as open source software
on SourceForge.
Indeed,
the release of WiX as OSS/FS appears to be quite a success;
after 328 days on SourceForge, the WiX project has on the order
of 120,000 downloads, and about two-thirds of the bugs logged have been fixed.
Stephen R. Walli, formerly of Microsoft, reports that
there’s a core of half a dozen developers
working predominantly on their own time
(so Microsoft doesn’t have to pay them).
Yet Windows development customers are “happy and directly
involved in the conversation with Microsoft employees.
One stunning submission came from a developer that built a
considerable tutorial on WiX. I did a quick page estimate and
it looks like this developer gave the WiX project at least
a month of his life.”
-
Is there really
a lot of OSS/FS software? Yes.
Freshmeat.net counts over 21,000 software branches of OSS/FS software
as of October 2002.
Sourceforge.net hosts 55,424 OSS/FS projects all by itself
(as of January 28, 2003).
The
dmoz list of just OS counts 114 OSS/FS OSes;
this includes old systems (re-enabling their support), experiments, and
specialized projects.
There’s little reason to believe that this counts all OSS/FS
software, but it certainly indicates there’s a large amount of it.
These projects vary in value and quality, of course,
just as proprietary programs do, but
all of these OSS/FS projects can be the basis of future work.
-
Is having the ability
to view and change source code really
valuable/important for many people? Surprisingly, yes.
It’s certainly true that few people need direct access to source code;
only developers or code reviewers need the ability to access and change code.
But not having access to how your computer is controlled is still
a significant problem.
Bob Young of Red Hat uses the analogy of
having your car’s hood welded shut to explain why even
non-technical users need access to the source code.
Here is his explanation, in his own words:
Open source gives the user the benefit of control over the
technology the user is investing in...
The best analogy that illustrates this benefit is with the way we buy cars.
Just ask the question, “Would you buy a car with the hood welded shut?”
and we all answer an emphatic “No.”
So ask the follow-up question, “What do you know about
modern internal-combustion engines?” and the answer for most
of us is, “Not much.”
We demand the ability to open the hood of our cars because it gives us,
the consumer, control over the product we’ve bought and takes it away
from the vendor.
We can take the car back to the dealer; if he does a good job,
doesn’t overcharge us and adds the features we need,
we may keep taking it back to that dealer.
But if he overcharges us, won’t fix the problem we are
having or refuses to install that musical horn we always wanted -- well,
there are 10,000 other car-repair companies that would be
happy to have our business.
In the proprietary software business, the customer has no
control over the technology he is building his business around.
If his vendor overcharges him, refuses to fix the bug
that causes his system to crash or chooses not to introduce
the feature that the customer needs, the customer has no choice.
This lack of control results in high cost,
low reliability and lots of frustration.
To developers, source code is critical.
Source code isn’t necessary to break the security of most systems, but
to really fix problems or add new features it’s quite difficult without it.
Microsoft’s Bill Gates
has often claimed that most developers don’t need
access to OS source code, but
Graham Lea’s article
“Bill Gates’ roots in the trashcans of history”
exposes that Gates actually extracted OS source code
himself from other
companies by digging through their trash cans.
Mr. Gates said,
“I’d skip out on athletics and go down to this computer center.
We were moving ahead very rapidly: Basic, FORTRAN, LISP,
PDP-10 machine language, digging out the OS listings
from the trash and studying those.”
If source code access isn’t needed by developers, why did he need it?
Obviously, there’s a significant advantage to developers if they can
review the source code, particularly of critical components such as an
operating system.
See also the discussion on the
greater flexibility of OSS/FS.
-
Is OSS/FS really just an anti-Microsoft
campaign? No.
Certainly there are people who support OSS/FS who are also against Microsoft,
but it’d be a mistake to view OSS/FS as simply anti-Microsoft.
Microsoft already uses OSS/FS software in its own applications;
Windows’ implementation of the basic Internet protocols
(TCP/IP) was derived from OSS/FS code, and its Office suite depends on
the OSS/FS compression library “zlib.”
Microsoft could, at any time, release programs such as
its OSes as OSS/FS,
take an existing OSS/FS OS and release it,
or provide applications for OSS/FS systems.
There is no licensing agreement that prevents this.
Indeed,
OSS/FS leaders often note that they are not against Microsoft per se, just
some of its current business practices, and many have repeatedly asked
Microsoft to join them
(e.g., see
Free Software Leaders
Stand Together).
In many cases OSS/FS is developed with and for Microsoft technology.
On June 21, 2002,
SourceForge listed 831 projects that use Visual Basic
(a Microsoft proprietary technology) and 241 using C#
(a language that originated from Microsoft).
A whopping 8867 projects are listed as working in Windows.
This strongly suggests that there are many OSS/FS developers who are
not “anti-Microsoft.”
Microsoft says it’s primarily opposed to the GPL,
but Microsoft sells a product with GPL’ed components.
Microsoft’s Windows Services for Unix includes Interix,
an environment which can run UNIX-based applications and scripts
on the Window NT and Windows 2000 OSes.
There’s nothing wrong with this; clearly, there are a lot of Unix
applications, and since Microsoft wants to sell its OSes,
Microsoft decided to sell a way to run Unix applications on its own products.
But many of the components of Interix are covered by the GPL,
such as gcc and g++ (for compiling C and C++ programs).
(Microsoft seems to keep moving information about this;
here
is a stable copy).
The problem is not what Microsoft is doing; as far as I can tell,
they’re following both the letter and the spirit of the law
in this product.
The problem is that
Microsoft says no one should use the GPL, and that no one can make
money using the GPL, while simultaneously making money using the GPL.
Bradley Kuhn (of the FSF)
bluntly said, “It’s hypocritical for them to
benefit from GPL software and criticize it at the same time.”
Microsoft executives are certainly aware of this use of the GPL;
Microsoft Senior Vice President Craig Mundie specifically
acknowledged this use of GPL software when he was questioned on it.
Kelly McNeill noted this dichotomy between claims and
actions in the June 22, 2001 story
“Microsoft Exposed with GPL’d Software!”
A more
detailed description about this use of the GPL by
Microsoft is given in The Standard on June 27, 2001.
Perhaps in the future Microsoft will try to remove many of these GPL’ed
components so that this embarrassing state of affairs won’t continue.
But even if these components are removed
in the future, this doesn’t change the fact
that Microsoft has managed to sell products that include
GPL-covered code without losing any of its own intellectual property rights.
That being said, there are certainly many people
who are encouraging specific OSS/FS products (such as Linux) so that
there will be a viable competition to Microsoft, or who are
using the existence of a competitor to obtain the best deal from
Microsoft for their organization.
This is nothing unusual - customers want to have competition for
their business, and they usually have it in most other areas of
business.
Certainly there is a thriving competing market for computer hardware, which
has resulted in many advantages for customers.
The New York Times’ position is that
“More than two dozen countries - including Germany and China -
have begun to encourage governmental agencies to use such
“open source” software ...
Government units abroad and in the United States and
individual computer users should look for ways to support
Linux and Linux-based products. The competition it offers helps everyone.”
-
I’ve always assumed there’s no free lunch;
isn’t there some catch?
If there is an OSS/FS product that meets your needs, there really isn’t
a catch.
Perhaps the only catch is misunderstanding the term “free.”
The GPL includes this (haiku) text:
“When we speak of free software, we are referring
to freedom, not price.”
I.E., OSS/FS is not necessarily cost-free.
In practice, it’s still often a bargain.
Naturally, if you want services besides the software
itself (such as guaranteed support, training, and so on),
you must pay for those things just like you would for
proprietary software.
If you want to affect the future direction of the software -
especially if you must have the software changed in some way to
fit it to your needs -
then you must invest to create those specific modifications.
Typically these investments involve hiring someone to make those changes,
possibly sharing the cost with others who also need the change.
Note that you only need to pay to change the software -
you don’t need to pay for permission
to use the software, or a per-copy fee, only
the actual cost of the changes.
For example, when IBM wanted to join the Apache group, IBM discovered there
really was no mechanism to pay in money.
IBM soon realized that the primary “currency” in OSS/FS is
software code, so IBM turned the money into code and all turned out very well.
This also leads to interesting effects that explains why many OSS/FS
projects start small for years, then suddenly leap into a mode where they
have a rapidly increasing functionality and user size.
For any application, there is a minimum level of acceptable
functionality; below this, there will be very few users.
If that minimum level is large enough, this creates an effect
similar to an “energy barrier” in physics;
the barrier can be large enough that most users are not willing to
pay for the initial development of the project.
However, at some point, someone may decide to begin the “hopeless”
project anyway.
The initial work may take a while, because the initial work is large and
there are few who will help.
However, once a minimum level of functionality is reached,
a few users will start to use it, and a few of them may be willing to help
(e.g., because they want the project to succeed or because they have
specialized needs).
At some point in this growth, it is like passing an energy barrier;
the process begins to become self-sustaining and exponentially increasing.
As the functionality increases, the number of potential users begins to
increase rapidly, until suddenly the project is sufficiently usable for
many users.
A percentage of the userbase will decide to add new features, and
as the userbase grows, so do the number of developers.
As this repeats, there is an explosion in the program’s capabilities.
OSS/FS programs have been competing for many years in
the server market, and are now well-established in that market.
OSS/FS programs have been competing for several years in the embedded
markets, and have already begun to significantly penetrate those markets
as well.
In contrast, OSS/FS programs currently have
only a small client (desktop and laptop) market share.
This is unsurprising; OSS/FS only began to become viable for client
computing in 2002, and it takes time for any software to mature,
be evaluated, and be deployed.
Since OSS/FS is a brand new contender in the client market,
it has only begun penetrating into that market.
However, OSS/FS use on client systems has grown signficantly,
and there are reasons to think that will grow even more
significantly in the future.
A few definitions are necessary first, before examining the issue
in more depth.
Many users’ only direct experience with computers is through their
desktop or laptop computers running “basic client applications” such as a
web browser, email reader,
word processor, spreadsheet, and presentation software
(the last three together are often called an “office suite”),
possibly with additional client applications,
and all of these must have a graphical user interface and
be supported by an underlying graphical environment.
Such computers are often called “client” computers (even if they
are not using the technical approach called the “client-server model”).
Another term also used is the “desktop”, even if the computer
is not on a desk.
The small OSS/FS desktop market share should
not be surprising, because viable OSS/FS client applications
only became available in 2002.
As a practical matter, client systems must be
compatible with the market leader, for example, the office suite must
be able to read and write documents in the Microsoft Office formats.
Before 2002 the available OSS/FS products could not do this well, and
thus were unsuitable for most circumstances.
Clearly, OSS/FS client applications cannot be considered unless they
are already available.
One point less understood is that OSS/FS operating systems
(like GNU/Linux) could not really compete with proprietary operating systems
on the client until OSS/FS (and not proprietary)
basic client applications and environment were available.
Clearly, few users can even consider buying a client system without
basic client applications, since that system won’t meet
their fundamental requirements.
There have been proprietary basic client applications for GNU/Linux
for several years, but they didn’t really make GNU/Linux
viable for client applications.
The reason is that
a GNU/Linux system combined with proprietary basic client applications
still lacks the freedoms and low cost of purely OSS/FS
systems, and the combination of GNU/Linux plus proprietary client applications
has to compete with established proprietary systems which have
many more applications available to them.
This doesn’t mean that GNU/Linux can’t support proprietary programs;
certainly some people will buy proprietary basic client applications,
and many people have already decided to buy many other kinds of
proprietary applications and run them on a GNU/Linux system.
However, few will find that a GNU/Linux system with proprietary basic client
applications has an advantage over its competition.
After all, the result is still proprietary, and
since there are fewer desktop applications of any kind on GNU/Linux,
many capabilities have been lost, little has been gained, and the switching
costs will dwarf those minute gains.
There is also the problem of transition.
Many organizations will find it too traumatic to immediately
switch all client systems to an OSS/FS operating system; it is often
much easier to slowly switch to OSS/FS basic client applications on the
pre-existing proprietary operating system, and then switch operating systems
once users are familiar with the basic client applications.
Thus, the recent availability of OSS/FS basic client applications has
suddenly made OSS/FS operating systems (like GNU/Linux) far more
viable on the client.
First, let’s look at the available market share figures.
According to the
June 2000 IDC survey of 1999 licenses
for client machines,
GNU/Linux had 80% as many client shipments in 1999 as Apple’s MacOS
(5.0% for Mac OS, 4.1% for GNU/Linux).
More recent figures in 2002
suggest that GNU/Linux has
1.7% of the
client OS market.
Clearly, the market share is small at this early stage.
Obviously, while this shows that there are many users (because there are
so many client systems), this is still small compared to
Microsoft’s effective monopoly on the client OS market.
IDC reported that Windows systems
(when they are all combined) accounted for 92% of the client operating
systems sold.
However, there are many factors that suggest that the situation is changing:
OSS/FS basic client software is now available,
there’s increasing evidence of their effectiveness,
Microsoft is raising prices, and
organizations (including governments) want open systems:
-
OSS/FS basic client software is available.
Back in 1997 I forecast that GNU/Linux would be “ready for the desktop”
in 2002-2003 (5 years later).
My forecast appears correct; OSS/FS applications and environments
matured in 2002 where they are finally functionally competitive on the client.
In 2002, Mozilla finally released version 1.0 of their suite
(including a web browser, email reader, and other tools), and
the first reasonably usable version of
OpenOffice.org, the first practically useful OSS/FS office suite,
was released in 2002 as well.
Desktop environments matured as well;
in 2002 both the GNOME and KDE projects released capable,
more mature versions of their desktop environments.
In addition the WINE product (a product that allows OSS/FS systems to
run Windows programs) was finally able to run Microsoft Office 97,
suggesting that although WINE is still immature, it may be sufficient
to run some Windows applications developed internally by some organizations.
Laster, in 2005, the Firefox web browser and Thunderbird
email programs were released as a next generation of the Mozilla work.
There are other plausible alternatives for client applications as well,
such as Evolution (an excellent mail reader),
Abiword (a lighter-weight but less capable
word processor which also released its version 1.0 in 2002),
Gnumeric (a spreadsheet),
and KOffice (an office suite).
However, I will emphasize OpenOffice.org, Firefox, and Thunderbird,
for two reasons.
First, they also run on Microsoft Windows, which makes it
much it easier to transition users from competitors
(this enables users to migrate a step at a time,
instead of making one massive change).
Second, they are full-featured, including compatibility
with Microsoft’s products; many users want to use fully-featured products
since they don’t want to switch programs just to get a certain feature.
In short, it looks like there are now several OSS/FS products that have
begun to rival their proprietary competitors in both usability and in the
functionality that people need, including
some very capable programs.
-
There is increasing evidence of OSS/FS client software effectiveness.
The
MOXIE study of January 2003
randomly acquired 100 documents from the Internet in
the Microsoft Office word processor, spreadsheet, and presentation
software formats.
Their leading OSS/FS contender, OpenOffice.org version 1.0.1, did well;
it was able to successfully use 97%, 98%, and 94% of the documents
(of the respective formats).
The study concluded that
“the current state of interoperability is reasonably good,
although there is significant room for improvement.”
Since that time, the OpenOffice.org developers have specifically worked to
improve interoperability with Microsoft Office, and it’s reasonable
to expect that the figures are significantly higher now.
-
Microsoft has raised its prices.
Microsoft is changing many of its practices, resulting in increasing
costs to its customers.
It has changed its licensing so that one copy of Windows cannot
be used for both home and office.
Microsoft has switched its largest customers to a subscription-based approach
(called “Licensing 6”),
greatly increasing the costs to its customers.
TIC/Sunbelt Software Microsoft Licensing Survey Results (covering
March 2002) reports the impact on customers
of this new licensing scheme.
80% had a negative view of the new licensing scheme, noting, for example,
that the new costs for software assurance
(25% of list for server and 29% of list for clients)
are the highest in the industry.
Of those who had done a cost analysis, an overwhelming 90%
say their costs will increase if they migrate to 6.0, and 76%
said their costs would increase from 20% to 300% from
what they are paying now under their current 4.0 and 5.0 Microsoft Licensing
plans.
Indeed, 38% of those surveyed said that they are actively seeking
alternatives to Microsoft products.
Licensing 6.0 can also significantly harm organizations trying
to sell off a part of its operations.
The program requires accelerated software maintenance payments
when the computers that are covered under the license are sold off - but
Microsoft is no longer obligated to provide maintenance
even if the contract is fully paid.
Gartner’s review of
Star Office (Sun’s variant of OpenOffice.org) also noted
that Microsoft’s recent licensing policies may accelerate moving
away from Microsoft.
As Gartner notes,
“This [new license program]
has engendered a lot of resentment among Microsoft’s customers,
and Gartner has experienced a marked increase in the number of clients
inquiring about alternatives to Microsoft’s Office suite...
enterprises are realizing that the majority of their users
are consumers or light producers of information,
and that these users do not require all of the advanced features
of each new version of Office...
unless Microsoft makes significant concessions in its
new office licensing policies,
Sun’s StarOffice will gain at least 10 percent market share at the
expense of Microsoft Office by year-end 2004 (0.6 probability).”
They also note that
“Because of these licensing policies, by year-end 2003,
more than 50 percent of enterprises will have an official strategy
that mixes versions of office automation products - i.e., between
multiple Microsoft Office versions or vendor products (0.7 probability).”
-
Organizations (including governments) want open systems.
Organizations, including governments, do not want to be locked into
products and services from a single vendor.
Multiple vendors mean competition between suppliers, generally
driving down costs and increasing quality.
See the
separate section on governments and OSS/FS.
There are some interesting hints that GNU/Linux is already starting
to gain on the client.
Some organizations, such as
TrustCommerce
and the
city of Largo, Florida,
report that they’ve successfully transitioned to using Linux on the desktop.
Many organizations have found a number of useful processes for
making this transition practical.
Many start by replacing applications (and not the operating system
underneath) with OSS/FS replacements.
For example, they might switch to
Mozilla as a web browser and email reader,
OpenOffice.org for an office suite.
Organizations can also move their infrastructure to web-based
solutions that don’t care about the client operating system.
Eventually, they can start replacing operating systems
(typically to a GNU/Linux distribution), but still
using various mechanisms to run Microsoft Windows applications on
them.
Various products allow users to run Microsoft Windows applications
on GNU/Linux, including Windows application servers, Wine, win4lin,
VMWare, and so on.
There’s already some evidence that others anticipate this;
Richard Thwaite, director of IT for Ford Europe,
stated in 2001 that an open source
desktop is their goal, and that they expect the industry to
eventually go there
(he controls 33,000 desktops, so this would not be a trivial move).
It could be argued that this is just a ploy for negotiation with
Microsoft - but such ploys only work if they’re credible.
There are other sources of information on OSS/FS or GNU/Linux for clients.
Desktoplinux.com
is a web site devoted to the use of GNU/Linux on the desktop; they
state that “We believe Linux is ready now
for widespread use as a desktop OS,
and we have created this website to help spread the word
and accelerate the transition to a more open desktop,
one that offers greater freedom and choice
for both personal and business users.”
Bart Decrem’s
Desktop Linux Technology & Market Overview, funded by
Mitch Kapor, gives a detailed analysis and prognostication
of GNU/Linux on the desktop.
Paul Murphy
discusses transitioning large companies to Linux and Intel (”Lintel”) on
the desktop, and concludes that one of the biggest risks is trying to
copy a Windows architecture instead of exploiting the different
capabilities GNU/Linux offers.
Indeed, it appears that many users are considering such a transition.
ZDNet published survey results on August 22, 2002, which asked
“Would your company switch its desktop PCs from Windows to Linux
if Windows apps could run on Linux?”
Of the more than 15,000 respondents, 58% said they’d
switch immediately;
another 25% said they’d consider dumping Windows in
favor of Linux within a year.
While all such surveys must be taken with a grain of salt, still, these
are not the kind of responses you would see from users happy with their
current situation.
They also noted that ZDNet Australia found that 55% of the
surveyed IT managers were considering switching from Microsoft products.
Most people do not expect that this transition, if it happens, will
happen quickly: it is difficult to change that many systems.
But the fact that it’s being considered at all is very intriguing.
A number of opinion pieces, such as
Charlie Demerjian’s
“The IT industry is shifting away from Microsoft” argue that
a major IT industry shift toward OSS/FS is already occurring,
across the board.
Many analysts believe Microsoft has extended Windows 98 support
because it’s worried that Windows 98 users might switch to GNU/Linux.
There are many reports from various users who have
switched to OSS/FS; here are a sample that you may find useful.
This is not an exhaustive list, nor can it be.
As discussed earlier,
the City of Largo, Florida
supports 900 city employees using GNU/Linux, saving about $1 million a year.
A
BusinessWeek online article notes that
Mindbridge shifted their 300-employee intranet software company from
Microsoft server products and Sun Solaris to GNU/Linux; after
experiencing a few minor glitches,
their Chief Operating Officer and founder Scott Testa says
they now couldn’t be happier, and summarizes that
“...we’re saving hundreds of thousands of dollars between
support contracts, upgrade contracts, and hardware.”
Amazon.com saved millions of dollars by switching to GNU/Linux.
Oracle’s Chairman and CEO, Larry Ellison, said that
Oracle will
switch to GNU/Linux to run the bulk of its business applications
no later than summer 2002, replacing three Unix servers.
A travel application service provider
saved $170,000 in software costs during the first six months
of using GNU/Linux (for both servers and the desktop);
it also saved on hardware and reported that
administration is cheaper too.
CRN’s Test Center found that
a GNU/Linux-based network (with a server and 5 workstations)
cost 93% less in software than a Windows-based network,
and found it to be quite capable.
The article
Linux
as a Replacement for Windows 2000 determined that
“Red Hat Linux 7.1 can be used as an alternative to Windows 2000...
You will be stunned by the bang for the
buck that Linux bundled free ‘open source’ software offers.”
Educational organizations have found OSS/FS software useful.
The
K12 Linux Terminal Server Project
has set up many computer labs in the U.S. Northwest in
elementary, middle, and high schools.
For example,
St. Mary’s School is a 450-student Pre-K through 8th grade school
in Rockledge, Florida that applying GNU/Linux using their approach.
Their examples show that kids don’t find GNU/Linux that hard to use
and quite able to support educational goals.
For example, third graders put together
simple web pages about their favorite Saints
using a variety of OSS/FS programs:
they logged into GNU/Linux systems,
typed the initial content using
Mozilla Composer (an OSS/FS web page editor),
drew pictures of the Saints using The Gimp (an OSS/FS drawing program),
and shared the results with Windows users using Samba.
The page
Why should open source software be used in schools?
gives various examples of educational organizations who have used OSS/FS
programs, as well as linking to various general documents on why
educational organizations should use OSS/FS.
The
letter from the Kochi Free Software Users’ Group
to the Government of Kerala and others also summarizes some
of the issues, especially why governments should specify standards
(and not products) for educational use.
The Faculty Senate of the University at Buffalo, State University of New York,
approved
a resolution strongly supporting the use of OSS/FS instead of
proprietary software.
The Northwest Educational Technology Consortium has an interest
set of information on OSS/FS on its website, in the section
Making Decisions
About Open Source Software (OSS) for K-12.
Many financial organizations use OSS/FS.
In 2005,
Industrial and Commercial Bank of China (ICBC),
China’s biggest bank,
signed an agreement with Turbolinux to integrate Linux
across its banking network;
this follows a September 2004 announcement by the
Agricultural Bank of China (ABC) that it would be moving to
Linux thin-client terminals based on an optimized Red Hat Linux distribution.
The Chicago Mercantile Exchange credits its migration to commodity
Intel-based servers and Linux with cutting costs and reducing a critical
100 milliseconds off the time required to complete each trade.
Online brokerage E*Trade is moving its computer systems
to IBM servers running GNU/Linux,
citing cost savings and performance as reasons for switching to GNU/Linux
(the same article also notes that
clothing retailer L.L. Bean and financial services giant Salomon Smith Barney
are switching to GNU/Linux as well).
Merrill Lynch
is switching to GNU/Linux company-wide,
and are hoping to save tens of millions of dollars annually
within three to five years.
Adam Wiggins
reports on TrustCommerce’s successful transition to Linux on the desktop.
An April 22, 2002 report
on ZDNet, titled “More foreign banks switching to Linux”,
stated that New Zealand’s TSB bank
“has become the latest institution to adopt
the open-source Linux OS.
According to reports, the bank is to
move all its branches to the Linux platform...
in Europe, BP and Banca Commerciale Italiana feature among
the big companies that have moved to Linux.
According to IBM, as many as 15 banks in central London
are running Linux clusters.”
They also mentioned that
“Korean Air, which now does all its ticketing on Linux,
and motorhome manufacturer Winnebago, are high-profile examples.”
The Federal Aviation Air Traffic Control System Command Center
in Herndon, Virginia
is currently installing a system to support 2,000 concurrent users
on Red Hat Linux.
The system, known as the National Log, will act as a
central clearinghouse database for users
in air traffic centers across the country.
ComputerWorld reported in October 2002 an
increasing use of GNU/Linux on Wall Street -
Merrill Lynch reports that a majority of new projects are interested
in GNU/Linux, for example, and the article references a TowerGroup
(of Needham, MA)
estimate that GNU/Linux is currently deployed on 7% of all servers
in North American brokerage firms.
TowerGroup also forecasts that
GNU/Linux use will grow at an annual rate of 22% in the
securities server market between 2002 and 2005, outpacing growth
in Windows 2000, NT and Unix deployments.
Some organizations are deploying GNU/Linux widely at the point of sale.
Many retailer cash registers are switching to GNU/Linux, according to
Information Week
(”Cash Registers are Ringing up Sales with Linux” by Dan Orzech,
December 4, 2000, Issue 815);
on September 26, 2002,
The Economist noted that “Linux is fast catching on among retailers.”
According to Bob Young (founder of Red Hat),
BP
(the petroleum company) is putting 3,000 Linux servers at gas stations.
Zumiez
is installing open-source software on the PCs at all its retail locations,
and expects that this will cut its technology budget
between $250,000 and $500,000 a year;
note that this includes using Evolution for email,
Mozilla for web browsing (to eliminate the need for
printed brochures and training manuals), and an open source spreadsheet program.
Sherwin-Williams, the number one U.S. paint maker,
plans to convert its computers and cash registers (not including
back office support systems) in over 2,500 stores
to GNU/Linux and has hired IBM to do the job;
this effort involves 9,700 NetVista desktop personal computers,
OSS/FS is also prominent in Hollywood.
Back in 1996, when GNU/Linux was considered by some to be a risk,
Digital
Domain used GNU/Linux to generate many images in Titanic.
After that, it burst into prominence as many others began using it,
so much so that a
February 2002
article in IEEE Computer stated that
“it is making rapid progress toward becoming the dominant OS
in ... motion pictures.”
“Shrek” and “Lord of the Rings” used GNU/Linux to power their
server farms, and now
DreamWorks SKG
has switched to using GNU/Linux exclusively on both the front and
back ends for rendering its movies.
Industrial Light & Magic
converted its workstations and renderfarm to Linux in 2001 while it
was working on Star Wars Episode II.
They stated that
“We thought converting to Linux would be a lot harder than it was”
(from their SGI IRIX machines).
They also found that the Linux systems are 5 times
faster than their old machines,
enabling them to produce much higher quality results.
They also use Python extensively (an OSS/FS language), as well as a number
of in-house and proprietary tools.
Disney is also shifting to GNU/Linux
for film animation.
Many remote imaging systems use GNU/Linux.
When a remote imaging system was placed at the North Pole,
reporters noted that the Linux mascot was a penguin and
announced that
Penguins invade the North Pole.
There are many large-scale systems.
In October 2002, Chrysler Group
announced it’s using a Linux cluster computer
for crash simulation testing and analysis
in an effort to make safer cars and trucks.
Their configuration uses 108 workstations, each with 2 processors, so
the system uses 216 computers all running Red Hat Linux,
and expect to improve simulation performance by 20%
while saving about 40% in costs.
OSS/FS is widely used by Internet-based companies.
Google
uses over 6,000 GNU/Linux servers.
Yahoo! is increasing
its already-massive use of OSS/FS. Yahoo claims it is the
“World’s most trafficked Internet destination,”
justified based on Nielsen/NetRatings of August 2002.
Yahoo had 201 million unique users, 93 million active registered users,
over 4500 servers, and over 1.5 billion pageviews a day.
Yahoo noted that OSS/FS already runs their business
(e.g., Perl, Apache, FreeBSD, and gcc), and they’ve recently decided to
move from their proprietary in-house languages to PHP (an OSS/FS language).
Afilias has switched the registration database for
the .org Internet domain
from the proprietary Oracle to the OSS/FS PostgreSQL database program;
.org is the fifth largest top-level domain, with more than 2.4 million
registered domain names.
Bloor Research
announced in November 2002 that they believe
GNU/Linux is ready to support large enterprise applications
(i.e., it’s “enterprise ready”).
They reached this conclusion after examining its
scalability, availability, reliability, security, manageability,
flexibility, and server consolidation characteristics,
They concluded that
“Linux now scales well on Intel hardware, and by taking advantage
of failover extensions from Linux distributors and Grid suppliers,
high availability can be achieved.
Linux is proven to be reliable, especially for dedicated applications,
and its open source nature ensures that it is at least
as secure as its rivals.”
Only 3 years earlier Bloor had said GNU/Linux wasn’t ready.
Librarians have also found many advantages to OSS/FS.
One interesting usage story is the story of
James Burgett’s Alameda County Computer Resource Center,
one of the largest non-profit
computer recycling centers in the United States.
Its plant processes 200 tons of equipment a month in its
38,000-square-foot warehouse.
It has given thousands of refurbished computers
to disadvantaged people all over the world, including as
human rights organizations in Guatemala,
the hard-up Russian space program, schools, and orphanages.
All of the machines have GNU/Linux installed on them.
Indeed, for well-established products like GNU/Linux, very strong
cases can be made for considering them.
On October 18, 2002,
Forrester Research
reported that “Linux is now ready for prime time.”
They stated that
“CIOs have many new reasons to be confident that they’ll get
quality Linux support from their largest application vendors and
systems integrators,” referencing Amazon, Oracle, Sun, and IBM, among
others who have made commitments that increase confidence that
GNU/Linux is ready for deployment.
Indeed, these uses are becoming so widespread that
Microsoft
admits that OSS/FS competition may force Microsoft to lower its prices,
at least in the server market.
Microsoft noted this in its 10-Q quarterly filing, stating that
“To the extent the open source model gains increasing market acceptance,
sales of the company’s products may decline,
the company may have to reduce the prices it charges for its products,
and revenues and operating margins may consequently decline.”
Summaries of government use in various countries are available from
Infoworld and
IDG.
Several organizations collect reports of OSS/FS use, and these might
be useful sources for more information.
Linux International
has a set of
Linux case studies/success stories.
Mandriva maintains
a site
recording the experiences of business users
of the Mandrake distribution.
Red Hat provides some similar information.
Opensource.org includes some
case
studies.
The Dravis Group LLC published in April 2003
Open Source Software:
Case Studies Examining its Use, examining several specific
use cases in depth.
Their study of several different organizations deploying OSS/FS
concluded the following:
- Cost is a significant factor driving adoption of open source software.
- Control and flexibility are considered benefits as well.
- Implementation of open solutions is evolutionary, not revolutionary.
- Open source extends across the entire software stack.
- Product support is not a significant concern.
- Open source is not a magic solution.
- Open standards may be more important than open source.
Practically all governments use OSS/FS extensively, and many
have policies or are considering policies related to OSS/FS.
Motivations vary; for many governments, the overriding rationale for
considering OSS/FS is simply to reduce costs.
Such governments will still take a variety of other factors
into account such as reliability, performance, and so on, just
like a commercial firm would do.
Some governments may also consider the special privileges granted to them
by OSS/FS; e.g., there are direct advantages to users if they can examine the
source code, modify the software to suit them, or redistribute the
software at will.
In contrast, some governments also consider OSS/FS
as a way of supporting other national policies.
Here is a list of some of the other considerations
that have been reported by various governments:
- supporting industrial policy -- a government may choose to support OSS/FS
to encourage the development of local companies who can
train, support, and tailor products.
Proprietary software products can only be maintained by a single company,
who are often foreign and do not allow the best software jobs
to be performed in that country
(and only that company can maintain the product).
- increasing competition / reducing dependence on, or
control by, any one company --
a government may wish to prevent any one company from completely controlling
the computing infrastructure of the government or its country;
this is especially of concern to many if that one company is foreign.
This is not necessarily the same as supporting industrial policy;
the goal may be to simply support improved competition, foreign or not.
After all, the effective monopolies in various software
markets can be viewed as a market failure that requires correction.
Lawrence Lessig’s
Code and Other Laws of Cyberspace
argues that “code is law” --
as computers become increasingly embedded in our world, what
their code does, allows, and prohibits
controls what we may or may not do in very a powerful way.
“If code is law, who are the lawmakers? What values are being embedded
in the code? Both questions are fundamentally about sovereignty.
Who should be building this [electronic] world, and who should be specifying
the values that this world will build into itself?”
Governments may be increasingly skeptical of a world where increasingly
its laws are rendered irrelevant by the controls of code from a single company.
Proprietary vendors can also threaten governments into doing what they want, by
threatening to withhold the product from that country --
are only possible because of the monopoly powers granted
to proprietary vendors.
They can also
threaten to pull out of countries, a threat again made stronger
because of their monopoly power.
- security -- many are concerned about the
security of software they depend on.
Often proprietary products are bought and later found to be full of security
vulnerabilities; OSS/FS products at least provide governments with the
option of detailed review of the source code, and to fix
problems themselves without waiting for the vendor.
Microsoft does have a “shared source” program for its operating system,
allowing governments to look at source code, but this program does not
generally permit the worldwide analysis and discussion that OSS/FS permits, nor
does it permit changes and redistribution by end-users.
In many cases, the proprietary vendor is foreign or has
foreign developers, which for some governments raises
additional concerns -- can the foreign company’s product be trusted?
For example, a special key in
Microsoft Windows called NSAKEY was identified years ago, and
whether or not this was a “back door” into Windows,
it did reveal that this was a concern of many governments.
Obviously, any developer can make a mistake leading to a security flaw, and
a malicious developer could write subversive OSS/FS software as well.
But many believe the additional (worldwide) transparency provided by OSS/FS,
and the ability to repair and redistribute OSS/FS programs immediately,
provides additional protection.
- record longevity -- OSS/FS reveals exactly how data is stored,
so that important data is not lost.
Governments using
proprietary data formats risk loss of critical records if the company
folds or stops supporting a particular format, stops supporting
a particular version of a format.
Unfortunately, this occurs distressingly often.
- transparency of government data --
OSS/FS enables complete review of exactly
what is done and what data is stored, so that the
public can freely receive that data without being required to
buy products from any particular vendor.
- localization --
OSS/FS can also be trivially localized, a critical advantage where
there are languages with a smaller number of speakers.
With OSS/FS, users do not need to convince a vendor to support their language,
they can simply add that capability themselves.
An interview about OpenOffice.org discusses some of these points.
For example, the United States federal government has a policy of
neutrality; they choose proprietary or OSS/FS programs simply considering
costs and other traditional measures.
In contrast,
Dr. Edgar David Villanueva Nuñez (a Peruvian Congressman)
has written a detailed letter explaining in detail
he believes it is beneficial (and necessary) for the Peruvian government
to prefer OSS/FS; his list of rationale was
“Free access to public information by the citizen,
permanence of public data, and
security of the state and citizens” (which are the rationales of
transparency, record longevity, and security above).
The Center for Strategic and International Studies
developed a
2004 survey of the OSS/FS positions of various
governments worldwide.
The Open Source and Industry Alliance (OSAIA)’s
“Roundup of Selected OSS Legislative Activity WorldWide”
(aka Policy Tracker)
surveys government OSS policies in 2003 and 2004.
The widely-cited
Free/Libre and
Open Source Software (FLOSS): Survey and Study
includes a great deal of information about public sector use of OSS/FS.
An older but broad survey was published in 2001 by CNet.
More information about governments and OSS/FS can be found at the
Center of Open Source and Government (eGovOS)
web site.
The
The Norwegian Board of Technology (an independent public think tank)
has a global country watch on Open Source policy.
The 2002
Brookings Institute’s “Government Policy toward Open Source Software”
has a collection of essays about government and OSS/FS.
Robin Bloor’s January 2005 article
noted that many countries now have a stated policy of a
preference for OSS/FS; countries where this is the case,
in some areas of government IT use, include Bahrain, Belgium,
China and Hong Kong, Costa Rica, France, Germany, Iceland, Israel,
Italy, Malaysia, Poland, Portugal, Philippines and South Africa.
He also noted that nearly
all “governments have R&D projects which are investigating
the practicality of Open Source for government use which will,
in all probability lead to local policy guidelines at some point
which favour open source.”
A
2002 New York Times article noted that
“More than two dozen countries in Asia, Europe and Latin America,
including China and Germany, are now encouraging their
government agencies to use ‘open source’ software”.
Robert Kramer of CompTIA
(Computer Technology Industry Association) says that
political leaders everywhere from California to Zambia
are considering legislating a preference for
Open Source software use;
he counted at least 70 active proposals for
software procurement policies that prefer OSS/FS in 24 countries
as of October 2002.
There are certainly debates on the value of OSS/FS preferences
(even a few OSS/FS advocates like Bruce Perens don’t support
mandating a government preference for OSS/FS),
but clearly this demonstrates significant positive interest in OSS/FS
from various governments.
Tony
Stanco’s presentation “On Open Source Procurement Policies”
briefly describes why he believes governments should consider OSS/FS.
Ralph Nader’s Consumer Project
on Technology gives reasons he believes
the U.S. government should encourage OSS/FS.
The paper
Linux Adoption in the Public Sector: An Economic Analysis
by
Hal R. Varian and Carl Shapiro (University of California, Berkeley;
1 December 2003)
makes several interesting points about OSS/FS.
This paper uses some odd terminology, for example,
it uses the term “commercial software” where it means “closed source
software” (this poor terminology choice makes the paper’s discussion
on commercial open source software unnecessarily difficult
to understand).
But once its terminology is understood, it makes some interesting points.
It notes that:
-
“The Linux operating system has achieved a ‘critical mass’
sufficient to assure users that it will be available and improved
for years to come, reducing the risk to users and to software developers.
-
... users adopting Linux are less likely
to face “lock-in” than those adopting proprietary platform software,
and they retain greater
control over their own computing environments.
These benefits are especially salient in complex
computing environments ... as often occurs in the public sector.
-
Open source software, such as Linux,
typically uses open interfaces [that] typically lead to
a larger, more robust, and more innovative industry
and therefore software with open interfaces
should be preferred by public sector officials,
as long as it offers comparable quality to proprietary alternatives.
-
Because Linux is open source platform software,
adoption of Linux can help spur the
development of a country’s software sector,
in part by promoting the training of programmers
that enables them to develop applications that run on the Linux platform.
The adoption of the Linux platform may well promote
the economic development of commercial software to run in that environment.
-
Fears that the licensing terms associated with Linux
discourage the development of commercial software are misplaced...
we expect mixed computing environments involving open source software and
commercial software, that employ both open and proprietary interfaces,
to flourish in the years ahead.
Governments can also approach OSS/FS differently for different
circumstances.
Governments need software to perform their own tasks, of course.
Many governments are trying to increase the availability of computers
(to reduce the “digital divide”), and many see OSS/FS as a useful way
to help do that
(e.g.,
Walter Bender, director of MIT’s Media Lab,
has recommended that Brazil install
OSS/FS on thousands of computers that will be sold to the poor,
and not proprietary software;
“Free software is far better on the dimensions of cost, power and quality.”).
And governments sometimes wish to influence their internal commercial
markets to improve their competitiveness.
Governmental organizations that choose to switch to OSS/FS products
can find a variety of documents to aid them.
Tom Adelstein has a short article on how to employ OSS/FS inside
governments (dated January 2005).
The
International Open Source Network (IOSN)
has a great deal of information about OSS/FS, and aids
developing countries in the Asia-Pacific region in applying OSS/FS;
they’ve produced documents such as
FOSS
education primer.
IOSN is
an initiative of the United Nations (UN) Development Programme’s (UNDP)
Asia Pacific Development Information Programme (APDIP),
and is supported by the
International Development Research Centre (IDRC) of Canada.
The Interchange of Data between Adminisrations (IDA)
Open Source Migration Guidelines (November 2003)
and German
KBSt’s Open Source Migration Guide (July 2003)
have useful information about such migrations
(though both are slightly dated, for example, some of the limitations
they note have since been resolved).
It’s also worth noting that there’s a resurging interest by
governments to require the use of standards
for data storage and data protocols that can be implemented by
anyone, without any discrimination against an implementor.
This desire is often not connected to OSS/FS, and predates the rise of
OSS/FS in the marketplace.
After all, governments have had a strong interest
in non-discriminatory standards for decades,
simply to prudently conduct business.
For example,
Massachusetts’ Eric Kriss noted that what the state really wants is
“open formats”, by which they mean
“specifications for data file formats that are based on
an underlying Open Standard developed by an open community
and affirmed by a standards body or de facto format standards
controlled by other entities that are fully documented
and available for public use under perpetual, royalty free,
and nondiscriminatory terms.”
As they note, governments need to be able to access
records 300 years later, and the risk of data loss if they use a
proprietary format is very great.
But such government goals do
dovetail nicely with the use of OSS/FS programs;
OSS/FS programs can implement open standards far more easily than
they can implement any secret pre-existing formats,
and OSS/FS source code aids in documenting a format.
Many countries favor or are considering favoring OSS/FS in some way,
such as
Peru,
the UK,
and
Taiwan.
In Venezuela, presidential decree 3,390 establishes
that all systems of the public administration should
preferentially use OSS/FS (libre software);
the Ministry of Science and Technology must
give the Presidency plans and programs
to support this.
(see an English translation)
The following sections describe some government actions in the
United States, Europe, and elsewhere.
There is also a section on some attempts or perceived attempts
to prevent government consideration of OSS/FS.
However, this information is by no means complete; this is simply a sample
of some of the ongoing activities.
There are many government users of OSS/FS in the United States,
and a variety of related policies, studies, and recommendations.
This includes departments and agencies of the federal government, as
well as state and local governments.
Many have advocated additional use or changes in approach.
A summary of some of this information is below.
The U.S. federal government has a formal policy of neutrality, that is,
OSS/FS and proprietary software must be considered using the
same criteria, as noted in
Office of Management and Budget memorandum M-04-16 of
July 1, 2004.
This mirrors the earlier
2003 OSS/FS policy of the U.S. Department of Defense, which
clearly states that OSS/FS and proprietary are both acceptable but must
follow the same rules.
Both also note that the license requirements for OSS/FS are different
than proprietary software, so acquirers should make sure they understand
the license requirements since they may be different from what they’re used to.
The United States’
Federal Enterprise Architecture
includes the Technical Reference Model (TRM),
and TRM version 1.1 (August 2003) includes both Linux and Apache.
The (U.S.) President’s Information Technology Advisory Committee (PITAC)’s
report, the
Recommendations
of the Panel on Open Source Software For High End Computing,
recommends that the U.S. “Federal government should encourage the
development of open source software as an alternate path for
software development for high end computing.”
See the separate discussion on
MITRE Corporation’s business
case study of OSS
(which emphasized use by the U.S. government, especially the U.S. military).
A NASA technical report describes in detail an approach
for NASA to release some of its software as open source software.
The U.S. National Imagery and Mapping Agency (NIMA) National Technical
Alliance, through the National Center for Applied
Technology (NCAT) consortium, funded the
Open Source Prototype Research (OSPR) project.
Under the OSPR project ImageLinks Inc., Tybrin Inc., Kodak Inc.,
and Florida Institute of Technology (Florida Tech) performed evaluations of
open source software development practices and demonstrated the
technological advantages of Open Source Software.
The
OSPR final report
includes those evaluations, a survey, and various related documents;
these are actually rather extensive.
The final report concludes:
Open Source Software development is a paradigm shift and has
enormous potential for addressing government needs.
Substantial technology leverage and cost savings can be achieved with
this approach.
The primary challenge will be in establishing an organizational structure
that is able to employ OSS methodology...
Often, some government organization has to build some software
to help implement a regulation, and it only makes sense to share that
software (instead of every other organization paying to rebuild it).
Making the software OSS/FS simplifies this kind of sharing.
The
Government Open Code Collaborative (GOCC)
is a “voluntary collaboration between public sector entities and
non-profit academic institutions. The Collaborative was created
for the purpose of encouraging the sharing, at no cost,
of computer code, developed for and by government entities where
the redistribution of this code is allowed.
Government entities, defined as a federal, state or local government,
an authority or other sub-national public sector entity of
the United States, can join the GOCC as Members.”
Another government project, the
Component Organization and Registration Environment (CORE),
is a “government source for business process and technical components.
CORE.GOV is the place to search for and locate a specific component
that meets your needs, or to find components you can customize to
meet your unique requirements.”
The
EUROPA - IDABC project has a similar role in Europe.
Federal Computer Week’s Linux Use Drives Innovation
notes that FBI officials started a project that became
the Emergency Response Network (ERN), a Linux-based
information-sharing system specifically to support emergency responses.
Jo Balderas, YHD Software’s chief executive officer,
said that by using widely-used OSS/FS,
“we can deliver fast, easy, cost-effective technology that
has successfully addressed many of the information-sharing challenges
that are obstacles to homeland security.”
The paper
Open Source and These United States
by C. Justin Seiferth
summarizes that:
The Department of Defense can realize significant gains by
the formal adoption, support and use of open licensed systems.
We can lower costs and improve the quality of our systems and
the speed at which they are developed.
Open Licensing can improve the morale and retention of Airmen
and improve our ability to defend the nation.
These benefits are accessible at any point in
the acquisition cycle and even benefit deployed and operational systems.
Open Licensing can reduce acquisition, development, maintenance
and support costs and increased interoperability
among our own systems and those of our Allies.
NetAction has proposed more OSS/FS use and encouragement by the government;
see
The Origins
and Future of Open Source Software by Nathan Newman
and
The
Case for Government Promotion of Open Source Software
by Mitch Stoltz
for their arguments.
More recently,
The
U.S. Department of Defense Information Systems Agency (DISA) has
certified Linux distributor Red Hat’s Advanced Server operating system
as a “Common Operating Environment” (COE),
meaning the server product meets the agency’s
software security and interoperability specification.
U.S. state governments have widely used OSS/FS too.
The Center for Digital Government’s 2003 “Best of the Web” awards
named the top 5 state web sites as Utah, Maine,
Indiana, Washington, and Arkansas.
Four of the five winning state web sites use OSS/FS programs
to implement their site.
The only state in the top five not using OSS/FS was Washington -
Microsoft’s home state.
Some states, such as
Massachusetts, have
a formal policy encouraging the use of open standards.
It is often easier to deploy OSS/FS, if you choose to do so, if you’re
already using open standards; it’s much more difficult to change
to either a proprietary or OSS/FS product if you’re stuck using
proprietary standards.
The 2004 report of the California Performance Review,
a report from the state of California, urges that
“the state should more extensively consider
use of open source software#&8221;,
stating that OSS/FS “can in many cases provide the same functionality as
closed source software at a much lower total cost of ownership”.
California’s Air Resources Board (ARB) has had a great deal of
experience with OSS/FS;
their web page on
ARB’s Open Source Initiatives
provides much more information.
Stanislaus County has
saved significant amounts of money through smart migration
to OSS/FS programs like Linux and JBoss.
Richard Robinson, the director of strategic business technology
(not the county’s CEO), once worked at Accenture (Anderson Consulting)
and has been working hard to identify the county’s needs and meet them.
In two years, he’s reduced costs in his department by 30-65%
depending on how you measure it.
In 2002, 2% of the county’s servers used Linux;
by 2004, 25% use Linux, and next year that’s expected to increase to 33%.
The Interchange of Data between Administrations (IDA) programme
is managed by the European Commission, with a
mission to “coordinate the establishment of
Trans-European telematic networks between administrations.”
IDA has developed a vast amount of OSS/FS information, including an
extraordinary amount of information specific to Europe.
IDA’s Open Source Observatory
provides a great deal of OSS/FS background information,
OSS/FS news,
European
OSS/FS case studies,
OSS/FS events
(both European and abroad), and other material.
IDA also provides
The IDA Open Source Migration Guidelines
to describe how to migrate from proprietary programs to OSS/FS programs.
The authors state that
“There are many reasons for Administrations to migrate to OSS.
These include: the need for open standards for e-Government;
the level of security that OSS provides; the elimination of forced change;
the cost of OSS. All these benefits result in far lower [Information
Technology] costs.”
Another paper of interest to governments considering OSS/FS is
Paul Dravis’ “Open Source Software: Perspectives for Development”,
developed for the World Bank Group.
The
Consortium for Open Source in the Public Administration
aims to analyze the effects of introducing open data standards
and Open Source software for personal productivity and document management
in European public administrations.
In 2002 an independent study
was published by the European Commission.
Titled
”Pooling Open Source Software”,
and financed by the Commission’s
Interchange of Data between Administrations (IDA) programme,
it recommends creating a clearinghouse to which administrations
could “donate” software for re-use.
This facility would concentrate on applications specific
to the needs of the public sector.
More specifically,
the study suggests that software developed for
and owned by public administrations should be issued
under an open source license,
and states that
sharing software developed for administrations could
lead to across-the-board improvements in efficiency of the European
public sector.
In October 2002, the European Commission
awarded Netproject a pilot contract valued at EUR250,000 to
examine deployment of OSS/FS in government departments.
As reported in the Washington Post on November 3, 2002,
Luis Millan Vazquez de Miguel, the minister of education,
science and technology in a western region of Spain called Extremadura,
is heading the launch of a government campaign to
convert all the area’s computer systems (in government offices,
businesses and homes) from the Windows operating system to GNU/Linux.
Vazquez de Miguel said over 10,000 desktop machines have already
been switched, with 100,000 more scheduled for conversion in the next year.
The regional government paid a local company $180,000 to create
a set of freely available software, and
invested in a development center that is creating customized software.
“So far, the government has produced 150,000 discs with the software,
and it is distributing them in schools, electronics stores, community centers
and as inserts in newspapers.
It has even taken out TV commercials about the benefits of free software.”
The Post also discussed some of the reasons some governments are
turning to OSS/FS.
“Among the touchiest issues that Microsoft faces outside the United States
is the uneasiness some countries have expressed about allowing an
American company to dominate the software industry in their country.
‘Non-U.S. governments in particular view open source as a way to break
the stranglehold against Microsoft.
If Microsoft owns everything their countries, their own companies
can’t get a foothold in the software industry,’ said Ted Schadler,
an analyst for Forrester Research Inc.”
Some Spanish government systems and those belonging to the
telecommunications company Telefonica recently were shifted to Linux
partly because of security concerns.
In Florence, legislators talked of breaking the
‘the computer science subjection of the Italian state to Microsoft.’ “
Germany intends to increase its use of OSS/FS.
IBM signed a Linux deal with Germany;
Germany’s Interior Minister, Otto Schilly,
said the move would help cut costs,
improve security in the nation’s computer networks, and
lower dependence on any one supplier.
Munich, Germany (the third largest German city) has decided to
migrate
all of its 14,000 computers in public administration to GNU/Linux and
other OSS/FS office applications, dropping Microsoft’s Windows in the
process.
USA Today gives a detailed discussion of
how this decision was made.
Here’s more information about the Munich approach.
The GNU/Linux system bid had a somewhat higher cost than the lowest cost
Microsoft bid, but when looking at the details,
the claim that Microsoft was lower cost appears misleading --
Microsoft’s bid
was significantly different than the GNU/Linux bid.
For example,
in Microsoft’s bid, the Windows systems wouldn’t be upgraded for 6 years.
Who doesn’t upgrade for 6 years?
If Munich had agreed to that in 1998, in 2004 they’d still be running only
Windows 98 and NT 4.0.
Also, in Microsoft’s low bid, many systems would only get the
word processor Word, not a full office suite
(GNU/Linux systems typically come with complete
office application suites at no additional cost, important for people
who suddenly need to read presentations and spreadsheets).
Also, some have noted that many of the costs for the GNU/Linux approach
can be viewed as a “removing Microsoft” cost rather than the
cost of using GNU/Linux per se; delaying the switch
could have made the cost of switching later even larger due to
increased lock-in.
It’s likely, however, that this decision was made with a long-term view
of many issues, not solely by cost.
In France,
the French police are switching from Microsoft Office to
OpenOffice.org, according to the French industry news service Toolinux.
More specifically, the group making this switch is the
“Gendarmerie Nationale française”, who act as police in the
French countryside but are technically part of the French Army.
According to the report, by the end of January 2005 about 35,000 PCs
and workstations will be to be equipped with the
OSS/FS office suite; by summer 2005 the number is to reach 80,000.
The French police expect to save more than two million euros by switching.
Finnish MPs are encouraging the use of GNU/Linux in government systems.
Statskontoret, the Swedish Agency for Public Management, has performed
a feasibility study on free and open source software and came to
very positive conclusions
(see the report in
English or
Swedish).
On October 10, 2002, the
Danish Board of Technology released a report
about the economic potential in using Open Source software in the
public administration.
The report showed a potential savings
of 3.7 billion Danish Kroners (500 million Euros) over four years.
A pilot project in the Hanstholm municipality
determined that switching the office suite from Microsoft Office to
OpenOffice.org and StarOffice did not increase their number of problems
and that each user
only needed 1 to 1.5 hours of training to learn the new office suite.
The municipality will now use OpenOffice.org and StarOffice on all
workplaces (200 in all) and will save 300,000 Danish Kroners
(about 40,000 Euros) each year in license fees.
They will still use Microsoft Windows as their OS.
You
may want to see the Danish government’s report on OSS/FS.
In July 2002, UK Government published a policy on
the use of Open Source Software.
This policy had the following points:
- UK Government will consider OSS solutions alongside proprietary
ones in IT procurements. Contracts will be awarded on a value for money
basis.
- UK Government will only use products for interoperability
that support open standards and specifications in all future IT
developments.
- UK Government will seek to avoid lock-in to proprietary IT products and services.
- UK Government will consider obtaining full rights to bespoke
software code or customisations of COTS (Commercial Off The Shelf)
software it procures wherever this achieves best value for money.
- UK Government will explore further the possibilities of using
OSS as the default exploitation route for Government funded R&D
software.
As follow-on work, the United Kingdom’s Office of Government Commerce (OGC)
performed “proof of concept” trials of Open Source Software (OSS) in a range
of public bodies. In October 2004 summarized its key findings
taking into account information from elsewhere.
Their
Government Open Source Software Trials Final Report is publicly
available, and has some very interesting things to say.
A
brief news article describes the report.
The report concludes that:
- Viability of OSS:
Open Source software is a viable and credible alternative to
proprietary software for infrastructure implementations, and for meeting the
requirements of the majority of desktop users;
- Obstacles to implementation:
The main obstacles to widespread implementation of
Open Source software are: for desktop applications, the current lack of complex
functionality which can affect ease of migration and interoperability for some
organisations; and for business applications,
the lack of Open Source products to
compete with large-scale proprietary enterprise-level products;
no significant obstacles
were noted for the adoption of Open Source in infrastructure developments;
- Costs and benefits:
Adoption of Open Source software can generate significant
savings in hardware and software costs for infrastructure implementation, and reduce
the licensing costs and hardware refresh requirements for desktop implementation;
- Lessons learned:
Adoption of Open Source, particularly for the desktop, requires
investment in planning, training of users, development of skills for implementation
and support, and detailed consideration of migration and interoperability issues.
The UK report recommended that public sector bodies should:
- examine carefully the technical and business case for implementation of Open Source
software and the role which OSS could play in current and future projects, working with
their outsourced IT providers where appropriate;
- review the potential for server consolidation, comparing the benefits of OSS with
proprietary solutions;
- consider the potential costs and benefits of migration to an OSS desktop for transaction
users, (potentially in conjunction with use of “thin client” architecture solutions);
- identify the role of open standards in future IS/IT strategy and policy, in conformance
with the e-Government Interoperability Framework (eGIF);
- consider requirements for the development of skills in Open Source development,
deployment and operation within the organisation, and review the availability of such
skills in their outsourced IT service providers;
- review their current infrastructure and applications - in collaboration with their outsourced
IT providers where relevant - well in advance of any planned procurement or renewal, and
determine whether current technologies and IT policies inhibit future choice; and if so
consider what steps may be necessary to prevent future “lock in”;
- consider the benefits of incremental change by diversifying OSS use beyond the server
platform to products like Email, LDAP, Web and internet Browser.
In 2005 the U.K. government announced that it is backing a new initiative
called the “Open Source Academy”, which is aimed at promoting
the use of open-source software in the public sector
(by local UK governments),
and providing a forum for those working in the public sector to test
and use such software.
It is funded by the Office of the Deputy Prime Minister (ODPM)
under its e-Innovations investment program.
One justification cited for the Open Source Academy was
a Dutch study published in January 2005 by the
Maastricht Economic Research Institute on Innovation and Technology,
which reported that 32% of local authorities in the U.K.
use OSS/FS, compared with 71% in France, 68% in Germany,
and 55% in the Netherlands.
Andy Hopkirk, head of research and development at the
National Computing Centre (NCC),
wasn’t sure that that the U.K. was “lagging so far behind on open source”,
but did admit that
“There is a cultural difference between the U.K. and rest of the world --
the U.K. is conservative in the uptake of new things and has a
let’s-wait-and-see attitude. There
is also the ‘not invented here’ syndrome.”
There seems to be a widespread perception that U.K. use is lower not
because the software is inappropriate, but because the U.K. local governments
are so risk-averse that they cannot seize opportunities when they
become available.
Thus, the “Open Source Academy” has the goal of ensuring that
local authorities know about their alternatives, and it also
“provides an opportunity for local authorities to get the
resources as well as the time and space to try things
out without risking their own infrastructures... It’s a type of sand-pit area.”
InfoWorld reported that
“Participants in the Open Source Academy are hoping that the program
will help the U.K. government catch up with the
rest of Europe in implementing open-source software as part
of government projects.”
More information on the Open Source Academy is available in the
eGov monitor and
InfoWorld.
A Linux
Journal article notes many interesting international
experiments and approaches,
for example, Pakistan plans to install 50,000 low cost computers
in schools and colleges all over Pakistan using GNU/Linux.
A
June 14, 2002 article in PC World also lists actions various
governments are taking.
The Korean
government announced that it plans to buy 120,000 copies of
Hancom Linux Deluxe this year, enough to switch 23% of its installed base
of Microsoft users to open source equivalents;
by standardizing on GNU/Linux and HancomOffice,
the Korean government expects savings of 80% compared
with buying Microsoft products (HancomOffice isn’t OSS/FS, but GNU/Linux is).
Taiwan
is starting a national plan to jump-start the development and use
of OSS/FS.
The
The Ministry of Defence in Singapore has installed OpenOffice.org
on 5,000 PCs as of November 2004, and is planning to deploy
it on a further 15,000 within the next 18 months after that.
Peru has even been contemplating
passing a law requiring the use of OSS/FS for public
administration (government);
rationale for doing so, besides saving money, include supporting
“Free access to public information by the citizen,
Permanence of public data, and the
Security of the State and citizens.”
Dr. Edgar David Villanueva Nuñez (a Peruvian Congressman)
has written a detailed letter explaining in detail the rationale for
the proposed law and why he believes it is beneficial (and necessary)
for the government.
In particular, he argues that this is necessary to provide basic
guarantees by the government:
Free access to public information by the citizen,
permanence of public data, and
security of the state and citizens.
Marc
Hedlund written has a brief description of the letter;
an English translation is available
(from
Opensource.org,
GNU in Peru,
UK’s
“The Register”, and
Linux Today);
there is a longer discussion of this
available at Slashdot.
Whether or not this law passes, it is an interesting development.
Brazil’s
government is planning to switch 300,000 computers to Linux says
a January 2005 story;
various
activists are encouraging such a switch.
Sun
Microsystems has announced a deal with China to provide one
million Linux desktops, and mentioned that China
“has pledged to deploy 200 million copies of
open standards-based desktop software”.
South Africa’s government departments are being officially
encouraged to stop using (expensive) proprietary software,
and to use OSS/FS instead.
This is according to a
January 15, 2003 announcement by
Mojalefa Moseki, chief information office
with the State Information Technology Agency (Sita).
South Africa plans to save 3 billion Rands a year
(approximately $338 million USD), increase spending
on software that stays in their country, and increase programming skill
inside the country.
Soutch Africa reports that its small-scale introductions have already
saved them 10 million Rands (approximately $1.1 million USD).
More
information is available at Tectonic
(see also
South
African minister outlines OSS plans).
The state of Oregon
is considering an OSS/FS bill as well.
Japan
has earmarked 1 billion yen for a project to boost
operating systems other than Microsoft Windows - it is expected
to be based on OSS/FS, particularly Linux,
and both South Korea and China are coordinating with Japan on it.
In December 2003,
Israel’s government suspended purchases of new versions of
Microsoft office software
and began actively encouraging the development of an open-source alternatives
(especially OpenOffice.org).
Indian President A.P.J. Abdul Kalam called for his country’s military to use OSS/FS to ward off cybersecurity threats;
as supreme commander of the Indian armed forces, this is a
directive he can implement.
Brendan Scott’s
Research Report: Open Source and the IT Trade Deficit
of July 2004 found that in just Australia, the costs of
just the closed source operating system were causing an Australian
trade deficit of $430 million per year.
The Australian Government Information Management Office
released in 2005
“A Guide to Open Source Software for Australian Government Agencies”.
There have been many discussions about the advantages of OSS/FS in
less developed countries.
Heinz and Heinz argue in their paper
Proprietary Software and Less-Developed Countries - The Argentine Case
that the way proprietary software is brought
to market has deep and perverse negative consequences regarding the chances
of growth for less developed countries.
Danny Yee’s
Free Software as Appropriate Technology
argues that Free Software is an appropriate technology
for developing countries, using simple but clear analogies.
Free
as in Education: Significance of the Free/Libre and
Open Source Software for Developing Countries,
commissioned by the Finnish Ministry for Foreign Affairs, examines
the significance of OSS/FS and related concepts; their
FLOSS for
Development website identifies other analyses of OSS/FS to support
their goal,
“To find out if and how Free/Libre and Open Source software
is useful for developing countries in their efforts
to achieve overall development, including bridging the digital divide.”
Many proprietary companies compete with OSS/FS products.
The rise of competition in IT markets, particularly in places where
there hadn’t been competition before, has had the general beneficial
effect of lowering the costs of software to governments.
Even simply threatening to use a different supplier is often
enough to gain concessions from all vendors, and since governments are
large customers, they often gain large concessions.
And of course all companies work to provide information on their products
that puts them in the best possible light.
Competing in terms of technical capabilities, cost, support, and so on
is a normal part of government acquisition, and not
further considered here.
However, there have been some efforts (or at least perceived efforts)
to prevent government use of OSS/FS, or
forbid use of the most common OSS/FS license (the GPL).
Generally these efforts have not had much success.
As described in
“Geek activism” forces Congress to reconsider Open Source,
in 2002 a letter from the U.S. Congress
unrelated to OSS/FS was modified by
Representative Adam Smith from Washington state.
Smith’s largest campaign donation source is Microsoft Corporation.
The modifications added statements strongly discouraging the use of the GPL.
The letter was originally signed by 67 Congressmen, but as
an Associated Press piece notes,
“Smith’s attack on open-source drew an angry response
from one of the original authors of the letter,
Rep. Tom Davis, R-Va.,
chairman of the House Government Reform subcommittee
on technology and procurement policy.
“We had no knowledge about that letter that twisted this
position into a debate over the open source GPL issues,”
said Melissa Wojciak, staff director of the subcommittee.
Wojciak added that Davis supports government funding of open-source projects.”
At the end,
“Many staffers of the 67 Congressman who signed are now claiming
they didn’t know what they were signing and the letter has
been withdrawn.”
Information Week also picked up the story.
Also in 2002, the Washington Post reported in 2002 that
there had been an
aggressive lobbying effort to squelch use of OSS/FS in the
the U.S. Department of Defense.
The effort didn’t work; the DoD released an official policy of
neutrality.
So many governments have begun
officially requiring that OSS/FS options be considered,
or enacting preferences for OSS/FS,
that Microsoft has sponsored an organization called the
Initiative for Software Choice.
Many observers
believe the real purpose of this organization
is to prevent governments from considering
the advantages or disadvantages of a software license
when they procure software, to prevent governments from requiring consideration
of OSS/FS products, and
to encourage the use of standards that inhibit the use of OSS/FS.
Indeed, Microsoft has invested large sums of money to lobby against
OSS/FS, according to CIO magazine.
An opposing group, founded by Bruce Perens, is
Sincere Choice.org,
which advocates that there be a
“fair, competitive market for computer software,
both proprietary and Open Source.”
Bruce Perens has published an article discussing why he believes
“Software Choice” is not what it first appears to be.
This doesn’t mean that governments always choose OSS/FS; quite the
contrary.
Indeed, most governments are quite conservative in their application of
OSS/FS implementations.
Articles such as
Linux in Government: In Spite of Endorsements,
Government Linux Projects Still Treading Water
and
Not So Fast, Linux
discuss some of the roadblocks and reasons governments don’t use OSS/FS
in various situations.
Interestingly, OSS/FS has forced Microsoft to be more open with its
code to various governments.
Bloomberg’s January 14, 2003 article
“Microsoft Has New Plan to Share Code With Government”
announces that Microsoft Corporation “will expand sharing
of the code underlying its Windows programs to help governments and agencies
such as Russia and the North Atlantic Treaty Organization (NATO)
improve computer security.”
It notes that
“Microsoft is facing competition from the Linux operating system,
which lets customers view and modify its source code.
In the government sector in particular, Microsoft has lost contracts to Linux,
analysts said.
More than 20 countries are looking at legislative proposals that
mandate considering or using Linux in government computers...
[and Microsoft has] begun to make the code available to governments,
as well as key customers and partners, in an effort to compete with Linux.”
Here are some other related information sources:
- There are several general
information sites about OSS/FS or Unix that might be of interest,
such as the
Free Software Foundation (FSF), the
Open Source Initiative website, and the
Linux.org site.
George Mason University’s Exploring and Collecting History Online (ECHO)
project has a useful collection in its material on
A Free and Open History of Free and Open Source Software, and
the
Massachusetts Institute of Technology (MIT)’s
Free / Open Source Research Community website also maintains a
useful collection of research papers.
An older paper is
John Kirch’s paper,
Microsoft Windows NT Server 4.0 versus UNIX.
(
also archived at the Internet Archives).
The book
The Cathedral and the Bazaar by Eric Raymond
examines OSS/FS development processes and issues.
A useful collection of many OSS/FS writings, including
the essay The Cathedral and the Bazaar, is in the
Open Source Reader.
Peter Wayner’s book
Free For All: How Linux and
the Free Software Movement Undercut the High-tech Titans describes
the history and rise of OSS/FS, and includes interviews with many key leaders;
the book can be either downloaded electronically without fee or
purchased as a hardcover book.
Ganesh C. Prasad has published
The Practical Manager’s Guide to Linux.
Dan Kegel’s
“The Case for Linux in Universities” discusses why students
need exposure to GNU/Linux at universities (and thus why universities
should support and encourage this).
The paper
Our Open Source / Free Software Future: It’s Just a Matter of Time
argues that within the next few years, the standard
de-facto OS that nearly everyone uses,
as well as much of the commodity software in widespread use,
will be OSS/FS.
You can see a collection of general information about OSS/FS at
my web page
listing OSS/FS references.
- MITRE Corporation
has examined the application of OSS/FS to military systems.
Their July 2001 report,
A Business Case Study of Open Source Software,
concludes that
“open source methods and products are well worth considering seriously
in a wide range of government applications, particularly if they are
applied with care and a solid understanding of the risks they entail.
OSS encourages significant software development and code re-use,
can provide important economic benefits, and has the potential for
especially large direct and indirect cost savings for military systems
that require large deployments of costly software products.”
They also recommend following the following steps to determine whether to
use OSS or proprietary products:
assess the supporting OSS developer community,
examine the market,
conduct a specific analysis of benefits and risks,
compare the long-term costs, and
choose your strategy.
MITRE has received a Leadership Award from the
non-profit Potomac Forum for showing that OSS can provide substantial
advantages over proprietary software, particularly when reliability and
long-term support are key requirements.
After that, in the
Washington Post article Open-source Fight Flares at Pentagon,
it was reported that
“Microsoft Corp. is aggressively lobbying the Pentagon to squelch its
growing use of freely distributed computer software and switch to
proprietary systems such as those sold by the software giant, according to
officials familiar with the campaign...”
But the effort backfired.
MITRE Corporation report, presumably in response to
such efforts, prepared a second report
at the request of the Department of Defense (DoD)
Defense Information Systems Agency (DISA).
The report was titled
“Use of Free and Open Source Software in the US Dept. of Defense”
and was originally dated May 10, 2002,
publicly released on October 28, 2002, and was updated slightly
in 2003.
This report concluded that OSS/FS use in the DoD
is widespread and should be expanded.
This MITRE report concluded that
“banning [OSS/FS] would have
immediate, broad, and strongly negative impacts on the ability
of many sensitive and security-focused
DoD groups to defend against cyberattacks.”
The report also found that the GPL so dominates in DoD applications
that a ban on just the GPL would have the same strongly negative impacts
as banning all OSS/FS.
MITRE noted that OSS/FS
“plays a far more critical role in the
DoD than has been generally recognized.”
In a two-week survey period MITRE
identified a total of 115 FOSS applications and 251 examples of their use.
MITRE concluded that
“Neither the survey nor the analysis supports the premise
that banning or seriously restricting
[OSS/FS] would benefit DoD security or defensive capabilities.
To the contrary, the combination of
an ambiguous status and largely ungrounded fears that
it cannot be used with other types of
software are keeping [OSS/FS] from reaching optimal levels of use.”
It short, MITRE found that OSS/FS is widely used,
and should be even more widely used.
On May 28, 2003,
the DoD issued a
formal memo placing OSS/FS on a level playing field with
proprietary software, without imposing any additional barriers
beyond those already leveled on its software.
The Post article also noted that
“at the Census Bureau, programmers used open-source software to launch a
Web site for obtaining federal statistics for $47,000, bureau officials
said. It would have cost $358,000 if proprietary software were used.”
- The European
Free/Libre and
Open Source Software (FLOSS): Survey and Study
is a large multi-part report examining OSS/FS from a number
of different vantage points.
The report is divided into the following (besides its summary and raw data):
- Part I: Use of Open Source Software in Firms and Public Institutions,
- Part II: Firms’ Open Source Activities: Motivations and Policy Implications
- Part II B: Open Source Software in the Public Sector: Policy within the European Union
- Part III: Basics of Open Source Software Markets and Business Models
- Part IV: Survey of Developers
- Part V: Source Code Survey
-
Computer Sciences Corporation (CSC) released in 2004 the large paper
Open Source: Open for Business
reporting many advantages to employing OSS/FS.
- Microsoft has been trying
to claim that open source is somehow dangerous,
and indeed is its leading critic, yet the
Wall Street Journal’s Lee Gomes found that
“Microsoft Uses Open-Source Code Despite Denying Use of such Software.”
Here are some interesting quotes from his article:
... But Microsoft’s statements Friday suggest the company has itself been
taking advantage of the very technology it has insisted would bring dire
consequences to others. “I am appalled at the way Microsoft bashes open
source on the one hand, while depending on it for its business on the
other,” said Marshall Kirk McKusick, a leader of the FreeBSD development team.
More recently Microsoft has targeted the GPL license
rather than all OSS/FS licenses, claiming that the GPL
is somehow anti-commercial.
But this claim lacks evidence, given the many commercial
companies (e.g., IBM, Sun, and Red Hat) who are using the GPL.
Also, see this paper’s earlier note that
Microsoft itself
makes money by selling a product with GPL’ed components.
The same article closes with this statement:
In its campaign against open-source, Microsoft has been unable to come up
with examples of companies being harmed by it. One reason, said Eric von
Hippel, a Massachusetts Institute of Technology professor who heads up a
research effort in the field, is that virtually all the available evidence
suggests that open source is “a huge advantage” to companies. “They are
able to build on a common standard that is not owned by anyone,” he said.
“With Windows, Microsoft owns them.”
Other related articles include
Bruce Peren’s comments,
Ganesh Prasad’s How Does the Capitalist View Open Source?,
and the open letter
Free
Software Leaders Stand Together.
- Indeed, many who have analyzed general information technology (IT) trends
or Microsoft’s actions have concluded that strongly depending on Microsoft’s
products is now a dangerous strategy.
2003 And Beyond by Andrew Grygus examines the IT industry
from a small business point of view, and identifies a large number of
dangers from depending on a Microsoft-based infrastructure.
Fundamentally, Microsoft is working hard to increase customer dependency,
and charges exorbitantly once the customer cannot practically switch.
- Microsoft inadvertently
advocated OSS/FS in leaked documents called the
”Halloween” documents.
The original first two Halloween documents found that OSS/FS was far more
effective than they wished to admit.
Halloween 7
gives results of one of their surveys, again, with many positive comments
about OSS/FS.
- Another leaked internal
Microsoft document is
Converting a UNIX .COM Site to Windows (by David Brooks).
This document
describes lessons learned when converting Hotmail from the OSS/FS FreeBSD to
Microsoft Windows after Microsoft purchased Hotmail, including advantages
and disadvantages of each approach, and ends up identifying a large number
of advantages of their competition.
For example, it noted that
“entrepreneurs in the startup world are generally familiar with
one version of UNIX (usually through college education),
and training in one easily converts to another.”
An article in
The Register summarizes many of the advantages of the Unix approach
given in the paper.
- Several documents were written to counter Microsoft’s statements such
as those in Microsoft’s “Linux Myths”.
This includes
LWN’s response
and
Jamin Philip Gray’s response, and the
FUD-counter site.
The
shared source page argues
that Microsoft’s “shared source” idea is inferior to open source.
Richard
Stallman’s The GNU GPL and the American Way
counters the amusing claim by Microsoft that the GPL was “un-American.”
The letter
Free Software
Leaders Stand Together argues against the statements
by Craig Mundie.
You can find many general sites about Microsoft,
including Cloweth’s site.
- In a story
full of ironies,
in 2002
Microsoft and Unisys
teamed up in a well-funded marketing campaign against Unix, in part
to try to revive Unisys’ sagging sales of Windows-based products.
The 18-month, $25 million campaign, dubbed “We have the Way Out,”
specifically attacked the Unix offerings of Sun, IBM, and Hewlett-Packard,
but since the major OSS/FS OSes are Unix or Unix-like, it
attacks them as well.
In a delicious irony, it was revealed that
the anti-Unix
campaign website is powered by Unix software -
in this case, FreeBSD (an OSS/FS version of Unix) and
the OSS/FS Web server Apache.
Once this was publicly revealed, Microsoft and Unisys quickly switched to
a Windows-based system.. and then
the website
failed to operate at all for several days.
If that wasn’t enough,
Andrew Orlowski reported in The Register a
further analysis of this website,
noting that port 3306 was open on their website -
a port primarily used by MySQL and Postgres.
In other words, it appears that their anti-Unix site was still using
OSS/FS software (not Microsoft’s own database) that is primarily
deployed on Unix-like systems.
Even their original imagery turns out to have had serious problems;
the campaign’s original graphic
showed a floor almost wholly covered in mauve paint (Sun Microsystem’s
color), and the alternative offered was to jump through a window.
Many
literate readers will recognize this symbol (the act of throwing
out through, or of being thrown out of, a window)
as defenestration, a way of killing rulers and also
a popular way of inviting kings to commit suicide in 17th century Europe.
In other words, this imagery
suggests that you should use the window[s] to commit suicide (!).
Leon Brooks then
analyzed the site further - and found that the “way out” site
used JSP (a technology fathered by Sun, Unix specialists).
He also found that the site violated many standards;
the site’s content failed the W3C validation suites (Microsoft
is a member of the W3C), and uses a Windows-only character set
that is not only non-standard, but actively conflicts with an
important international standard (and ironically one which Microsoft is
actively promoting).
If using only Windows is so wonderful, why can’t the advocacy site
conform to international standards?
The real problem here, of course, is that trying to convince
people that Unix is to be avoided at all costs - while
using Unix and then having serious problems when
trying to use an alternative - is both ironic and somewhat hypocritical.
But by August 2004,
Unisys decided to
adopt Linux on its ES7000 Intel processor-based servers,
responding to customer demand.
In a 2005 interview, Unisys’ Steve Rawsthorn admitted
“Not having Linux in our kitbag precluded us from some bids...
It got to the point we were being asked for it [Linux], and we had to do it.”
-
“How Big Blue Fell For Linux”
is an article on how IBM transitioned to becoming a major backer.
IBM announced that it planned to invest $1 Billion in GNU/Linux in 2001
all by itself
(see the
IBM
annual report).
In 2002
IBM reported that they
had already made almost all of the money back;
I and others are a little skeptical of these claims,
but it’s clear that IBM has significantly invested in GNU/Linux
and seem to be pleased with the results
(for an example, see their
Linux-only mainframe).
This is not just a friendly gesture, of course;
companies like
IBM view OSS/FS software as a competitive advantage, because
OSS/FS frees them from control by another organization, and it also
enables customers
to switch to IBM products and services (who were formerly locked into
competitor’s products).
Thankfully, this is a good deal for consumers too.
In 2002, IBM had
250 employees working full time to improve Linux.
-
For a scientifically unworthy but really funny look at what people
who use the various OSes say, take a look at the
Operating System Sucks-Rules-O-Meter.
It counts how many web pages make statements like “Linux rocks”.
It’s really barely an opinion poll,
but if nothing else it’s great for a laugh.
- There have been several academic studies of OSS/FS.
For example,
“A Framework for Open Source Projects”
(a Master Thesis in Computer Science by Gregor J. Rothfuss)
describes a framework for describing Open Source projects,
introducing notions of actors, roles, areas, processes and tools,
and depicts their interrelationships.
The goal was to provide a conceptual foundation and
a help for organizing and managing Open Source projects.
- Several studies examine developers (instead of the programs
they write), including
“A Quantitative
Profile of a Community of Open Source Linux Developers”,
Herman,
Hertel and Niedner’s study (based on questionnaires), and the
Who Is Doing It (WIDI) study.
The European
Free/Libre and Open Source Software
Survey (FLOSS) has a large amount of information on developers.
The paper
Two Case Studies of Open Source Software
Development: Apache and Mozilla
examines two major open source projects, the Apache web server and
the Mozilla browser, and using archives
(such as source code change history and problem reports) they quantify
aspects of developer participation, core team size, code ownership,
productivity, defect density, and problem resolution intervals
for these projects.
The Boston Consulting Group/OSDN
Hacker Survey (release 0.73, July 21, 2002)
made some interesting observations by sampling SourceForge users.
For example,
it gives evidence that open source developers can be divided into four
groups (based on their motivations for writing OSS/FS software):
- Believers (19%): believe source code should be open.
- Learning and Fun (29%): for non-work needs and intellectual stimulation.
- Hobbyists (27%): need the code for a non-work reason.
- Professionals (25%): for work needs and professional status.
Journalists sometimes like to romanticize OSS/FS developers as being mostly
teenage boys with little experience,
but the survey didn’t support that view.
Young people doing important development is certainly a great story,
and it certainly happens.
For example,
13-year-old Elizabeth Garbee will give a presentation on extending Tuxracer.
But the study found that the open source developers surveyed are mostly
experienced professionals, having an average of 11 years of programming
experience; the average age was 28.
The paper
“Altruistic individuals, selfish firms?
The structure of motivation in Open Source Software” by
Andrea Bonaccorsi and Cristina Rossi
(First Monday, January 2004)
discusses a 2002 survey of 146 Italian firms supplying
OSS/FS, and compared that with surveys of individual programmers.
It found significant differences between motivations of individuals
and firms, with firms emphasizing economic and technological reasons.
The top reasons (in order) of OSS/FS-supplying firms were
(1) because OSS allows small enterprises to afford innovation,
(2) because contributions and feedback from the Free Software community
are very useful in fixing bugs and improving software,
(3) because of the reliability and quality of OSS,
(4) because the firm wants to be independent of the
price and licence policies of large software companies, and
(5) because we agree with the values of the Free Software movement.
- If you determine that you wish to start an OSS/FS project, there are
some documents available to aid you.
This includes the
Free Software Project Management HOWTO and
Software Release Practice HOWTO.
You should also read
The Cathedral and the Bazaar.
- Other evaluations include the
Gartner
Group
and
GNet evaluations.
For general information on OSS/FS, see my
list of
Open Source Software / Free Software (OSS/FS) references at
http://www.dwheeler.com/oss_fs_refs.html
OSS/FS has significant
market share in many markets,
is often the most
reliable software,
and in many cases has the best performance.
OSS/FS scales,
both in problem size and project size.
OSS/FS software often has far better security,
perhaps due to the possibility of worldwide review.
Total cost of ownership
for OSS/FS is often far less than
proprietary software, especially as the number of platforms increases.
These statements are not merely opinions; these effects
can be shown quantitatively, using a wide variety of measures.
This doesn’t even consider
other issues that are hard to measure,
such as freedom from control by a single source, freedom from
licensing management (with its accompanying risk of audit and litigation),
Organizations can transition to OSS/FS in part or in
stages, which for many is a far more practical transition approach.
Realizing these potential OSS/FS benefits may require
approaching problems in a different way.
This might include using thin clients, deploying a solution by
adding a feature to an OSS/FS product, and
understanding the differences between the proprietary and OSS/FS models.
Acquisition processes may need to change to include specifically identifying
OSS/FS alternatives, since simply putting out a “request for proposal”
may not yield all the viable candidates.
OSS/FS products are not the best technical choice in
all cases, of course; even organizations which strongly prefer OSS/FS
generally have some sort of waiver process for proprietary programs.
However, it’s clear that considering OSS/FS alternatives can be beneficial.
Of course, before deploying any program you need to evaluate how well
it meets your needs, and some organizations do not know how to evaluate
OSS/FS programs.
If this describes your circumstance, you may wish to look at the
companion articles
How to Evaluate
OSS/FS Programs and the
Generally Recognized
as Mature (GRAM) list.
This paper cannot possibly list all the possible OSS/FS programs that
may be of interest to you.
However, users of Windows who are looking for desktop software
often try programs such as
OpenOffice.org (OSS/FS office suite),
Firefox (OSS/FS web browser), and
Thunderbird (OSS/FS mail browser).
Projects like The OpenCD project
creates CDs that include those (and other) OSS/FS programs for Windows
with nice installers and so on.
Many OSS/FS programs aren’t available for Windows, though, or do not
work as well on Windows.
Those interested in trying out GNU/Linux operating system
often start with a simple CD that doesn’t touch their hard drive,
such as
Gnoppix
or
Knoppix.
They then move on to various Linux distributions such as
Red Hat (inexpensive
Fedora Core or
professionally-supported
Red Hat Enterprise Linux),
Novell/SuSE,
Mandriva (formerly MandrakeSoft),
or
Ubuntu
(nontechnical users may also be interested in pay-per-month distributions like
Linspire, while
technically knowledgeable users may be interested in distributions like
Debian).
OSS/FS options should be carefully considered any
time software or computer hardware is needed.
Organizations should ensure
that their policies encourage, and not discourage,
examining OSS/FS approaches when they need software.
This appendix gives more information about
open source software / free software (OSS/FS):
definitions related to OSS/FS,
(of source code, free software, open source software,
and various movements),
motivations of developers and developing companies,
history,
license types,
OSS/FS project management approaches, and
forking.
There are official definitions for the terms “Free Software”
(as the term is used in this text) and “open source software”.
However, understanding a few fundamentals about computer software is necessary
before these definitions make sense.
Software developers create computer programs by writing text, called
“source code,” in a specialized language.
This source code is often mechanically translated into a format
that the computer can run.
As long as the program doesn’t need to be changed (say, to support
new requirements or be used on a newer computer), users don’t necessarily
need the source code.
However, changing what the program does usually requires possession and
permission to change the source code.
In other words, whoever legally controls the source code controls what
the program can and cannot do.
Users without source code often cannot have the program changed
to do what they want or have it ported to a different kind of computer.
The next two sections give the official definitions of Free Software and
Open Source Software (though in practice, the two definitions are essentially
the same thing); I then discuss some related defintions, and
contrast the terms “Free Software” and “Open Source Software”.
A.1.1 Definition of Free Software
OSS/FS programs have existed since digital computers were invented,
but beginning in the 1980s, people began to try capture the concept in words.
The two main definitions used are the “free software definition”
(for free software) and the “open source definition”
(for open source software).
Software meeting one definition usually meets the other as well.
Since the term “free software” came first, we’ll examine its definition first.
The
Free Software Definition
is published by Richard Stallman’s Free Software Foundation.
Here is the key text of that definition:
“Free software” is a matter of liberty, not price. To
understand the concept, you should think of “free” as in “free speech,”
not as in “free beer.”
Free software is a matter of the users’ freedom to run, copy,
distribute, study, change and improve the software. More precisely, it
refers to four kinds of freedom, for the users of the software:
- The freedom to run the program, for any purpose (freedom 0).
- The freedom to study how the program works, and adapt it to
your needs (freedom 1). Access to the source code is a precondition for
this.
- The freedom to redistribute copies so you can help your neighbor (freedom 2).
- The freedom to improve the program, and release your
improvements to the public, so that the whole community benefits.
(freedom 3). Access to the source code is a precondition for this.
A program is free software if users have all of these
freedoms. Thus, you should be free to redistribute copies, either with
or without modifications, either gratis or charging a fee for
distribution, to anyone anywhere. Being free to do these things means
(among other things) that you do not have to ask or pay for permission.
You should also have the freedom to make modifications and use them
privately in your own work or play, without even mentioning that they
exist. If you do publish your changes, you should not be required to
notify anyone in particular, or in any particular way.
The freedom to use a program means the freedom for any kind of person
or organization to use it on any kind of computer system, for any kind
of overall job, and without being required to communicate subsequently
with the developer or any other specific entity.
The text defining “free software” is actually much longer,
explaining further the approach.
It notes that
“Free software does not mean non-commercial.
A free program must be available for commercial use, commercial development,
and commercial distribution.
Commercial development of free software is no longer unusual;
such free commercial software is very important.”
A.1.2 The Open Source Definition
Open source software is officially defined by the
open source definition:
Open source doesn’t just mean access to the source code. The
distribution terms of open-source software must comply with the
following criteria:
1. Free Redistribution
The license shall not restrict any party from selling or giving away the
software as a component of an aggregate software distribution containing
programs from several different sources. The license shall not require a
royalty or other fee for such sale.
2. Source Code
The program must include source code, and must allow distribution in
source code as well as compiled form. Where some form of a product is
not distributed with source code, there must be a well-publicized
means of obtaining the source code for no more than a reasonable
reproduction cost preferably, downloading via the Internet without
charge. The source code must be the preferred form in which a
programmer would modify the program. Deliberately obfuscated source
code is not allowed. Intermediate forms such as the output of a
preprocessor or translator are not allowed.
3. Derived Works
The license must allow modifications and derived works, and must allow
them to be distributed under the same terms as the license of the original
software.
4. Integrity of The Author’s Source Code
The license may restrict source-code from being distributed in modified
form only if the license allows the distribution of “patch files” with
the source code for the purpose of modifying the program at build time.
The license must explicitly permit distribution of software built from
modified source code. The license may require derived works to carry a
different name or version number from the original software.
5. No Discrimination Against Persons or Groups
The license must not discriminate against any person or group of persons.
6. No Discrimination Against Fields of Endeavor
The license must not restrict anyone from making use of the program in
a specific field of endeavor. For example, it may not restrict the program
from being used in a business, or from being used for genetic research.
7. Distribution of License
The rights attached to the program must apply to all to whom the program
is redistributed without the need for execution of an additional license
by those parties.
8. License Must Not Be Specific to a Product
The rights attached to the program must not depend on the program’s being
part of a particular software distribution. If the program is extracted
from that distribution and used or distributed within the terms of the
program’s license, all parties to whom the program is redistributed should
have the same rights as those that are granted in conjunction with the
original software distribution.
9. The License Must Not Restrict Other Software
The license must not place restrictions on other software that is
distributed along with the licensed software. For example, the
license must not insist that all other programs distributed on the
same medium must be open-source software.
10. No provision of the license may be predicated on any individual
technology or style of interface.
The Open Source Definition was actually derived from the
Debian Free Software Guidelines (DFSG); those original guidelines are still
maintained and used by the widely-used and influential Debian project.
Thus, the Debian guidelines are nearly identical to the Open Source Definition,
yet Debian tends to use the term “Free Software” in its materials.
In addition, the debian-legal mailing list discusses licensing issues
in great depth, in an effort to evaluate licenses based on
the freedoms they grant or do not grant.
The DFSG and
Software License FAQ states that
“The DFSG is not a contract.
This means that if you think you’ve found a loophole in the DFSG
then you don’t quite understand how this works.
The DFSG is a potentially imperfect attempt to express what
free software means to Debian.”
The DFSG and
Software License FAQ also defines three additional “tests”
used on the debian-legal mailing list
to help them evaluate whether or not a license is “Free” (as in freedom).
These tests aren’t the final word, but because they’re described as
scenarios, they are sometimes easier for people to understand
(and I quote the Debian FAQ here):
- The Desert Island test.
Imagine a castaway on a desert island with a solar-powered computer.
This would make it impossible to fulfill any requirement
to make changes publicly available or to send patches to some
particular place.
This holds even if such requirements are only upon request,
as the castaway might be able to receive messages but be unable to send them.
To be Free, software must be modifiable by this unfortunate castaway,
who must also be able to legally share modifications with
friends on the island.
- The Dissident test.
Consider a dissident in a totalitarian state who wishes to
share a modified bit of software with fellow dissidents,
but does not wish to reveal the identity of the modifier,
or directly reveal the modifications themselves,
or even possession of the program, to the government.
Any requirement for sending source modifications to anyone other than
the recipient of the modified binary -
in fact any forced distribution at all, beyond giving source
to those who receive a copy of the binary -
would put the dissident in danger.
For Debian to consider software Free it must not
require any such excess distribution.
- The Tentacles of Evil test.
Imagine that the author is hired by a large evil corporation and,
now in their thrall, attempts to do the worst to the users of the program:
to make their lives miserable, to make them stop using the program,
to expose them to legal liability, to make the program non-Free,
to discover their secrets, etc.
The same can happen to a corporation bought out by a
larger corporation bent on destroying Free software in order to
maintain its monopoly and extend its evil empire.
The license cannot allow even the author to take away the required freedoms!
And there are practical issues that arise too:
- GPL compatibility is very desirable.
The GPL is by far the most popular OSS/FS license. Thus, an OSS/FS license that
isn’t compatible with the GPL causes many practical problems,
because the vast amount of GPL software can’t be combined with it.
Indeed, if a specification cannot be implemented by software released under
the GPL, it essentially discriminates against OSS/FS business models in
general because so much OSS/FS is released under the GPL.
Choosing a GPL-compatible license (such as the BSD-new, MIT/X, LGPL, or
GPL license) is often the safest course.
See my paper
for more information on why selecting a GPL-compatible license
is important for OSS/FS projects.
-
Having many OSS/FS licenses (”license proliferation”) is undesirable.
Bruce
Perens’ article “The Open Source Definition” explained back in 1999
that “Do not write a new license if it is possible to use one
of [small set of common licenses listed in the paper].
The propagation of many different and incompatible licenses
works to the detriment of Open Source software because fragments
of one program cannot be used in another program with an incompatible license.”
New licenses also make it hard for customers and developers
to understand what their requirements are.
More recently, there have been increasingly active steps to discourage
creating new OSS/FS licenses (which are typically corporate vanity licenses),
instead of using one of a small set of licenses that are already in wide use.
For more information, see comments by
Danese Cooper (Intel and secretary/treasurer for the Open Source Initiative
(OSI)) and
Chris DiBona (Google),
as well as the article
“HP exec calls for fewer open-source licenses” by
Robert McMillan (ComputerWorld, August 6, 2004).
- Choice-of-law and choice-of-venue requirements are very undesirable.
Many developers strongly object
to licenses that specify that the licensee must agree
to be judged by the laws of a specific jurisdiction
and/or be judged at a specific location.
This was a key problem, for example, for the older Python licenses.
The problem is that choice-of-law and choice-of-venue requirements
create superfluous incompatibilities
with any other licenses with choice-of-law and/or
choice-of-venue restrictions (which would, in practice, always be
different from each other).
A goal of OSS/FS licenses is to allow software to be combined and modified in
new, innovative ways, and such statements interfere with that goal.
- Advertizing clauses are very undesirable.
Some old licenses, like the old BSD license, required that credit be given
to developers in certain ways, e.g., whenever a product is advertized.
When there’s only one developer, that doesn’t sound too bad.
But imagine what happens as more developers get involved -- suddenly
each advertisement has to individually list (say) 20,000 people!
These kinds of licenses don’t scale well as more people become involved,
and major OSS/FS projects can involve large numbers of developers.
Crediting developers in the source code is very common practice,
of course, but that’s not the same thing.
A technical discussion examining the freedom of a license
might compare the license against the Free Software Definition (all four
freedoms), the Open Source Definition (every point) and/or the
Debian Free Software Guidelines, and the tests (scenarios) above, as
well as considering practical concerns like the ones above.
An example of such analysis is
Mark Shewmaker’s August 2004 examination of the
Microsoft Royalty Free Sender ID Patent License.
As a practical matter, the definitions given above for free software
and open source software are essentially the same.
Software meeting the criteria for one generally end up meeting the other
definition as well; indeed, those who established the term “open source”
describe their approach as marketing approach to Free Software.
However, to some people, the connotations and motives are different
between the two terms.
Some people who prefer to use the term “free software”
intend to emphasize that software should always meet such criteria
for ethical, moral, or social reasons, emphasizing that these should
be the rights of every software user.
Such people may identify themselves as members of the
“free software movement”.
Richard Stallman is a leader of this group;
his arguments are given in his article
Why “Free Software” is better than “Open Source”
Some people are not persuaded by these arguments, or
may believe the arguments but do not think that they are
effective arguments for convincing others.
Instead, they prefer to argue the value of OSS/FS on other grounds, such
as cost, security, or reliability.
Many of these people will prefer to use the term “open source software”,
and some may identify themselves as part of the
“open source movement”.
Eric Raymond was one of the original instigators of the name
“open source” and is widely regarded as a leader of this group.
Is the “free software movement” a subset of the “open source movement”?
That depends on how the “open source movement” is defined.
If the “open source movement” is a general term describing anyone
who supports OSS or FS for whatever reason, then the
“free software movement” is indeed a subset of the “open source movement”.
However, some leaders of the open source movement (such as Eric Raymond)
specifically recommend not discussing user freedoms,
and since this is the central principle of the free software movement,
the two movements are considered separate groups by many.
The
Free/Libre and Open Source Software
Survey (FLOSS), part IV, summarizes a survey of OSS/FS developers
(primarily European developers), and specifically examined these terms.
In this study, 48.0% identified themselves as part
of the “Free Software”, community,
32.6% identified themselves as part of the
“open source” community, and
13.4% stated that they did not care.
A slight majority (52.9%) claimed that the movements different
in principle, but the work is the same, while
29.7% argued that the movements were fundamentally different, and
17.3% do not care at all about the differences.
After examining the data, the surveyers determined that OSS/FS developers
could be divided into six groups:
- developers who assign themselves to the Free Software community
and who see fundamental differences between the two communities (18%).
- developers who consider themselves as part of the Open Source community
and who perceive fundamental differences between the two communities (9%).
- developers who assign themselves to the Free Software community
and who perceive only principle differences between the two communities,
but consider work in the two communities the same (26%).
- developers who assign themselves to the Open Source community
and see principle, but no fundamental differences between
the two communities (17%).
- developers who assign themselves to either
the Free Software or the Open Source Software community,
but are not bothered by differences between the two communities (9%).
- developers who do not care to which community they belong (20%).
This difference in terminology and motivation
can make it more difficult for authors of articles on OSS/FS (like this one).
The motivations of the different movements may be different, but since
practice the developers usually work together, it’s very useful
to have a common term that covers all groups.
Some authors choose to use one of the terms (such as OSS).
Other authors use some other term merging the two motivations, but
as of this time there is no single merged term used by everyone.
This article uses the merged term OSS/FS.
This leads to a more general and
oft-asked question:
“Why do developers contribute to OSS/FS projects?”
The short answer is that there are many different motivations.
The Boston Consulting Group/OSDN
Hacker Survey (release 0.73, July 21, 2002)
made some interesting observations by sampling SourceForge users.
The top motivations given for participating in
OSS/FS development were as follows:
- intellectually stimulating (44.9%)
- improves skill (41.3%)
- work functionality (33.8%)
- code should be open (33.1%)
- non-work functionality (29.7%)
- obligation from use (28.5%)
By examining these motivations, they concluded that
open source developers could be divided into four
groups (based on their primary motivations for writing OSS/FS software):
- Believers (19%): believe source code should be open.
- Learning and Fun (29%): for non-work needs and intellectual stimulation.
- Hobbyists (27%): need the code for a non-work reason.
- Professionals (25%): for work needs and professional status.
Part IV of the
Free/Libre and Open Source Software
Survey (FLOSS), mentioned above, also examined
individual developer motivations, and found a variety of motivations.
Many businesses contribute to OSS/FS development, and their motivations
also vary.
Many companies develop OSS/FS to sell support -
by giving away the product, they expect to get far more support contracts.
Joel Spolsky’s “Strategy Letter V” notes that
“most of the companies spending big money to develop open source software
are doing it because it’s a good business strategy for them.”
His argument is based on microeconomics, in particular, that
every product in the marketplace has substitutes and complements.
A substitute is another product you might buy if the first product
is too costly, while
a complement is a product that you usually buy together with another product.
Since demand for a product increases when the prices
of its complements decrease,
smart companies try to commoditize their products’ complements.
For many companies, supporting an OSS/FS product turns a complementary
product into a commodity, resulting in more sales (and money) for them.
One widely-read essay discussing commercial motivations is
Eric Raymond’s
The Magic Cauldron.
The European Free/Libre and
Open Source Software (FLOSS): Survey and Study has additional
statistics on the motivations of individuals and corporations who
develop OSS/FS.
In the early days of computing (approximately 1945 to 1975),
computer programs were often shared
among developers, just as OSS/FS practitioners do now.
An important during this time period was the ARPAnet
(the early form of the Internet).
Another critical development was the operating system Unix,
developed by AT&T researchers, and distributed as source code
(with modification rights) for a nominal fee.
Indeed, the interfaces for Unix eventually became the basis of the
POSIX suite of standards.
However, as years progressed, and especially in the 1970s and 1980s, software
developers increasingly closed off their software source code from users.
This included the Unix system itself; many had grown accustomed to the
freedom of having the Unix source code, but AT&T suddenly increased fees
and limited distribution,
making it impossible for many users to change the software they used
and share those modifications with others.
Richard Stallman, a researcher at the MIT Artificial Intelligence Lab,
found this closing of software source code intolerable.
In 1984 he started the GNU project
to develop a complete Unix-like operating system which would be Free Software
(free as in freedom, not as in price, as described above).
In 1985, Stallman established the Free Software Foundation (FSF)
to work to preserve, protect and promote Free Software;
the FSF then became the primary organizational sponsor of the GNU Project.
The GNU project developed many important software programs, including
the GNU C compiler (gcc) and the text editor emacs.
A major legal innovation by Stallman was the GNU
General Public Licence (GPL), a widely popular OSS/FS software license.
However, the GNU project was stymied in its efforts to develop the
“kernel” of the operating system.
The GNU project was following the advice of academics to use a
“microkernel architecture,” and was finding it difficult to develop
a strong kernel using this architecture.
Without a kernel, the GNU project could not fulfill their goal.
Meanwhile, the University of California at Berkeley had had a long
relationship with AT&T’s Unix operating system, and
Berkeley had ended up rewriting many Unix components.
Keith Bostic solicited many people to rewrite the remaining key utilities
from scratch, and eventually managed to create a nearly-complete system
whose source code could be freely released to the public without restriction.
The omissions were quickly filled, and soon a number of operating systems
were developed based on this effort.
Unfortunately, these operating systems
were held under a cloud of concern from lawsuits
and counter-lawsuits for a number of years.
Another issue was that since the BSD licenses permitted companies to
take the code and make it proprietary, companies such as Sun and BSDI
did so - continuously siphoning developers from the openly sharable code,
and often not contributing back to the publicly available code.
Finally, the projects that developed these operating systems tended to be
small groups of people who gained a reputation for rarely accepting
the contributions by others (this reputation is unfair, but nevertheless
the perception did become widespread).
The descendants of this effort include the capable operating systems
NetBSD, OpenBSD, and FreeBSD, as a group called the *BSDs.
However, while they are both used and respected,
and proprietary variants of these (such as Apple Mac OS X) are thriving,
another OSS/FS effort quickly gained the limelight and much more market share.
In 1991, Linus Torvalds began developing a small operating system kernel
called “Linux”, at first primarily for learning about the Intel 80386 chip.
Unlike the BSD efforts, Torvalds eventually settled on the GPL license,
which forced competing companies working on the kernel code to work together.
Advocates of the *BSDs dispute that this is an advantage, but
even today, major Linux distributions hire key kernel developers to work
together on common code, in contrast to the
corresponding commercial companies to the *BSDs which often do not
share their improvements to a common program.
Torvalds made a number of design decisions that in retrospect were
remarkably wise: using a traditional monolithic kernel design
(instead of the “microkernel approach” that slowed the GNU project),
using the the Intel 386 line as the primary focus, working to support user
requests (such as “dual booting”), and supporting hardware that was
technically poor but widely used.
And finally, Torvalds stumbled into a development process rather different
from traditional approaches by exploiting the Internet.
Torvalds’ new process looked rather different than more traditional approaches.
He publicly released new versions extremely
often (sometimes more than once a day,
allowing quick identification when regressions occurred), and he
quickly delegated areas to a large group of developers
(instead of sticking to a very small number of developers).
Instead of depending on rigid standards, rapid feedback on small
increments and Darwinian competition were used to increase quality.
When the Linux kernel was combined with the already-developed
GNU operating system components and some components from other places
(such as from the BSD systems), the
resulting operating system was surprisingly stable and capable.
Such systems were called GNU/Linux systems or simply Linux systems.
Note that there is a common misconception in the media that needs to be
countered here:
Linus Torvalds never developed the so-called “Linux operating system”.
Torvalds was the lead developer of the Linux kernel, but
the kernel is only one of many pieces of an operating system;
most of the GNU/Linux operating system was developed
by the GNU project and by other related projects.
In 1996, Eric Raymond realized that Torvalds had stumbled upon a
whole new style of development, combining the sharing possibilities of OSS/FS
with the speed of the Internet into a new development process.
His essay
The
Cathedral and the Bazaar identifies
that process, in a way that others could try to emulate the approach.
The essay was highly influential, and in particular convinced
Netscape to switch to an OSS/FS approach for its next generation web browser
(the road for Netscape was bumpy, but ultimately successful).
In spring of 1997, a group of leaders in the Free Software
community gathered, including Eric Raymond, Tim O’Reilly, and Larry Wall.
They were concerned that the term “Free Software” was too confusing and
unhelpful (for example, many incorrectly thought that the issue was having
no cost).
The group coined the term “open source” as an alternative term, and
Bruce Perens developed the initial version of the
“open source definition” to define the term.
The term “open source” is now very widely used, but not universally so;
Richard Stallman (head of the FSF) never accepted it, and even Bruce
Perens switched back to using the term “Free Software” because Perens felt
that there needed to be more emphasis on user freedom.
Major Unix server applications (such as the OSS/FS Apache web server)
were easily moved to GNU/Linux or the *BSDs,
since they all essentially implemented the POSIX standards.
As a result,
GNU/Linux and the *BSDs rapidly gained significant market share
in the server market.
A number of major initiatives began to fill in gaps
to create completely OSS/FS modern operating systems, including
graphical toolkits, desktop environments, and major desktop applications.
In 2002, the first user-ready versions of capable and
critical desktop applications
(Mozilla for web browsing and OpenOffice.org
for an office suite) were announced.
You can learn more about the history of OSS/FS from
material such as
Open
Sources: Voices from the Open Source Revolution and
Free for All: How Linux and the Free Software Movement
Undercut the High-Tech Titans by Peter Wayner,
There are dozens of OSS/FS licenses, but the vast majority of OSS/FS
software uses one of the four major licenses:
the GNU General Public License (GPL),
the GNU Lesser (or Library) General Public License (LGPL),
the MIT (aka X11) license, and the BSD-new license.
Indeed the Open Source Initiative refers to these four licenses as the
classic open source licenses.
The GPL and LGPL are termed “copylefting” licenses
(
also called
“protective” licenses), that is,
these licenses are designed to prevent (protect)
the code from becoming proprietary.
Here is a short description of these licenses:
- The GPL allows anyone to use the program and modify it, but
prevents code from becoming proprietary once distributed and it also
forbids proprietary programs from “linking” to it.
- The MIT and BSD-new licenses let anyone do almost anything with the code
except sue the authors.
One minor complication:
there are actually two “BSD” licenses, sometimes called “BSD-old” and
“BSD-new”; new programs should use BSD-new instead of BSD-old.
- The LGPL is a compromise between the GPL and the MIT/BSD-new approaches,
and was originally intended for code libraries.
Like the GPL, LGPL-licensed software
cannot be changed and made proprietary, but
the LGPL does permit proprietary programs to link to the library, like
the MIT/BSD-new licenses.
Note that all of these licenses (the GPL, MIT, BSD-new, and LGPL)
permit the commercial sale and the commercial use of the software,
and many such programs as sold and used that way.
See Perens’ paper for more information comparing these licenses.
The most popular OSS/FS license by far is the GPL.
For example, Freshmeat.net reported on April 4, 2002
that 71.85% of the 25,286 software branches (packages) it tracked
are GPL-licensed (the next two most popular were LGPL, 4.47%,
and the BSD licenses, 4.17%).
Sourceforge.net reported on April 4, 2002 that the GPL accounted
for 73% of the 23,651 “open source” projects it hosted
(next most popular were the LGPL, 10%, and the BSD licenses, 7%).
In my paper
More than a Gigabuck:
Estimating GNU/Linux’s Size,
I found that Red Hat Linux, one of the most popular GNU/Linux distributions,
had over 30 million physical source lines of code in version 7.1,
and that 50.36% of the lines of code were licensed solely
under the GPL (the next most common were the MIT license, 8.28%,
and the LGPL, 7.64%).
If you consider the lines that are dual licensed
(licensed under both the GPL and another license, allowing
users and developers to pick the license to use),
the total lines of code under the GPL accounts for 55.3% of the total.
My paper
on GPL compatibility discusses these figures further,
and discusses why, if you choose to develop OSS/FS code, you should
strongly consider using a licensing approach that is compatible with the GPL.
There are whole books about software licensing in general, or
OSS/FS licensing in particular, if you wish to delve into this
topic in depth.
One book about OSS/FS licensing is
Understanding Open Source and Free Software Licensing
by Andrew M. St. Laurent.
There is no single approach to managing an OSS/FS project, just as there
is no single approach to managing proprietary projects.
Management approaches are strongly influenced by the size and scope
of the project, as well as the leadership styles of those managing
the project.
The Cathedral and the Bazaar argues for a particular style
of development, termed the “bazaar” style.
In this approach, there are a large number of small, incremental releases,
and a large number of developers can send in patches for proposed
improvements.
The releases need to compile and run (to some extent), so that developers
can test and improve them.
Not all OSS/FS projects work this way, but many do.
It is useful to examine the management approaches of
successful projects to identify approaches that may work elsewhere.
Here are a few:
- Linux kernel.
The Linux kernel’s development process is based on a hierarchy of
four levels: ordinary developers, maintainers, trusted lieutenants, and the
benevolent dictator.
Ordinary developers can propose changes, but usually they submit their
proposals to a maintainer of a particular component of the kernel;
the maintainers then send their sets up to a
trusted lieutenants, who then sends it up to the benevolent dictator
(currently Linus Torvalds).
At each stage testing can take place.
The benevolent dictator writes code and issues general direction, but his
primary job is to be the integrator and arbiter of changes.
In the past (and probably again in the future) there were two branches,
the “stable” and “development” branches, where occasionally the
development branch would become the new stable branch.
As of the end of 2004,
the kernel development process has been modified so that someone else
(Andrew Morton at the end of 2004) manages a “development” stage, and
once Torvalds determines a specific change is ready, it’s brought into
the main stable version.
Linux distributions then take the stable branch, test it further, and
select the “best” version of the stable branch.
BusinessWeek named Linus Torvalds as one of the best managers of 2004.
- Apache.
The Apache web server project, in contrast, is run by a group.
At the top is the
“Apache HTTP Server Project Management Committee (PMC)”
a group of volunteers who are responsible for managing
the Apache HTTP Server Project.
Membership in the Apache PMC is by invitation only and must
be approved by consensus of the active Apache PMC members.
Membership can be revoked by a unanimous vote of all
the active PMC members other than the member in question.
Most changes are approved by consensus.
An action item requiring consensus approval must receive at
least 3 binding +1 votes and no vetos (a “-1” vote).
An action item requiring majority approval must receive at least
3 binding +1 votes and more +1 votes than -1 votes
(i.e., a majority with a minimum quorum of three positive votes).
Ideas must be review-then-commit; patches can be commit-then-review.
With a commit-then-review process, they trust that the
developer doing the commit has a high degree of confidence in the change.
Doubtful changes, new features, and large-scale overhauls need
to be discussed before being committed to a repository.
See the Apache
Voting Rules for more detailed information.
- Perl.
Perl was originally developed by Larry Wall, but he no longer
wishes to have to always have the job of integrating patches.
Thus, there is a notional
“patch pumpkin” that must be acquired to change Perl.
In Moody’s Rebel Code, Wall explains that
“we have essentially a chief integrator who is called the pumpkin holder.”
Moody adds that this “integration involves taking the approved
patches and adding them into the main Perl source code.”
Larry Wall, as original developer, can veto any change.
More information about the patch pumpkin (as it has currently evolved)
is available from perl.com.
- Sourceforge-based Applications.
Many OSS/FS projects are supported by SourceForge,
which includes the CVS tool for configuration management.
Typically, those who have write access to the repository simply make their
updates; others who do not have such access post their requests
or patches to the bug tracking database (or mailing list) and
ask one of those with write access to include it.
There are typically only a few people with direct write access, so conflicts
are rare and CVS supports resolving the occasional conflict.
Successful OSS/FS projects generally have a large number of
contributors. A small proportion of the contributors write a majority
of the code, but the value of the rest should not be underestimated;
the fact that many others are reviewing the system, to identify or fix
special bugs, enables the other developers to be more productive
(because someone else, who looks at the project in a different way,
can find or fix a bug faster, relieving the majority developers to do
other things).
Large groups can be surprisingly effective at converging to
good answers.
An interesting analysis of this concept in general is given in
“The Wisdom of Crowds:
Why the Many Are Smarter Than the Few and How Collective
Wisdom Shapes Business, Economies, Societies and Nations”
by James Surowiecki.
Groklaw
reviewed this book.
A fork is a competing project
based on a version of the pre-existing project’s source code.
All OSS/FS projects can be “forked”; the ability to create a fork is
fundamental to the definition of OSS/FS.
Simply creating or releasing a variant of a project’s code
does not normally create a fork unless there’s an intent to create
a competing project.
Indeed, releasing variants for experimentation is considered normal
in a typical OSS/FS development process.
Many OSS/FS projects (such as the Linux kernel development
project) intentionally have “fly-offs”
(also called “bake-offs”)
where different developers implement different competing approaches;
the results are compared and the approach that produces the best
results (the “winner”) is accepted by the project.
These “fly-offs” are often discussed in evolutionary terms, e.g.,
the “winning mutation” is accepted into the project
and the alternatives are
abandoned as “evolutionary dead ends”.
Since all parties intend for the “best” approach
to accepted by the project,
and for the other approaches to be abandoned, these are not forks.
What is different about a fork is intent.
In a fork, the person(s) creating the fork intend
for the fork to replace or compete with
the original project they are forking.
Creating a fork is a major and emotional event in the OSS/FS community.
It similar to a call for a “vote of no confidence” in
a parliament, or a call for a labor strike in a labor dispute.
Those creating the fork are essentially stating that they believe the
project’s current leadership is ineffective, and are asking developers
to vote against the project leadership by
abandoning the original project and switching to their fork.
Those who are creating the fork must argue why other developers should
support their fork;
common reasons given include a belief that
changes are not being accepted fast enough,
that changes are happening too quickly for users to absorb them,
that the project governance is too closed to outsiders,
that the licensing approach is hampering development, or
that the project’s technical direction is fundamentally incorrect.
Most attempts to create forks are ignored, for there must be a strong
reason for developers to consider switching to a competing project.
Developers usually resist supporting OSS/FS forks:
they divide effort that would be more effective when combined,
they make support and further development more difficult, and they require
developers to discuss project governance
rather than improving the project’s products.
Developers can attempt to support both projects, but this is usually
impractical over time as the projects diverge.
Eric Raymond, in Homesteading the Noosphere, argues that
a prime motivation in OSS/FS development is reputation gain through the
use of a gift culture, and that forking significantly interferes
with this motivation.
There are four different possible outcomes of a fork attempt,
and all of them have occurred in the history of OSS/FS.
These outcomes, along with historical examples, are:
- The death of the fork (example: libc/glibc). This is by far the most
common outcome; indeed, many forks never receive enough support to “die”.
- A re-merging of the fork (example: gcc/egcs); this is where the
projects rejoin each other (though one or the other may be the dominant
source of the combined effort).
- The death of the original (example: XFree86/X.org).
- Successful branching -- both succeed, typically catering to
different communities (examples: GNU emacs / xemacs, OpenBSD).
Here is more information about these examples:
- glibc vs. libc.
When the Linux kernel was first being developed, the kernel developers
took the FSF’s GNU C library (now called glibc)
and created their own fork of it (called libc).
Both were licensed under the LGPL.
At the time, the Linux kernel developers thought that the FSF’s development
process for the C library was too slow and not responding to their needs.
Thus, they
created a forked version
of GNU libc version 1.07.4 (which had been released February 17, 1994).
In this case, however, the original GNU C library project (led by the FSF)
surpassed the forked project over time.
Over the next few years the original
glibc increasingly offered far better standards conformance,
multithreading, higher performance, and more features than the
forked libc project.
Elliot
Lee briefly describes this history.
In this case, the fork was abandoned after several years;
in 1997 through 1998 nearly all GNU/Linux systems switched from libc back
to glibc.
- gcc vs. egcs.
The GNU Compiler Collection (gcc) is a collection of important compilers,
including a C++ compiler; the main compilers are licensed under the GPL.
In 1997, there were disagreements over the development approach and
slow development speed of gcc.
In particular, many were dissatisfied with the FSF-appointed gcc maintainer,
who was very slow to accept changes.
Cygnus (headed by Michael Tiemann) decided to create a fork
of the project named egcs, and invited others to join.
Egcs worked at an accelerated pace, and soon surpassed the original gcc project.
In April 1997 the rift was healed;
the FSF agreed to switch to using the egcs code for gcc,
and the egcs project agreed to dissolve itself and take over the
original gcc project.
In this case, the fork ended with the forking project’s results
“taking over” the original project.
- Free86 vs. X.org.
The XFree86 project historically led development of a popular X server.
An X server is a critical component for implementing a
graphical user interface in a typical Unix-like system.
The XFree86 project traditionally licensed the vast majority
of its code used the simple
“MIT/X” open source license that is
GPL-compatible.
The XFree86 president, David Dawes, decided to change the
XFree86 license to one that wasn’t GPL-compatible and had many
practical problems.
This proposed license change caused a serious uproar, but the
project leader refused to listen to those complaints.
For example,
Jim Gettys, a well-respected developer and co-founder of X,
strongly opposed this change to the XFree86 license, even though he’s
not a strong advocate of the GPL.
Richard Stallman politely asked that something be worked out.
But the project leader wouldn’t budge, so the users and some of the
developers forked the project, creating a new project at X.org based
on the previous version.
An article at
Linux Today
and a discussion at Freedesktop.org
show that the leading distributors, including
Red Hat, Debian, SuSE, Gentoo, Mandrake, and OpenBSD,
are switching or plan to switch from XFree86 to X.org.
Since the XFree86 folks wouldn’t switch to a GPL-compatible license,
the X.Org Foundation (formed January 2004) announced its own
version of X on April 6, 2004.
The X.Org foundation version was immediately endorsed by
Novell’s SUSE, Red Hat, HP, TrollTech, and FSF Europe among others.
Very soon, nearly all developers and users had abandoned XFree86.
You can see more information in my
cautionary
tale about XFree86.
This is a case where a project leader attempted to make an extremely
unpopular licensing change, causing a mass exodus of its uses and developers.
Note how similar this process was to a vote of no confidence; the leader
was unwilling to listen to his customers and developers, so his customers
and developers established a project where their needs would be met.
- GNU emacs / xemacs, OpenBSD.
Sometimes, though this is rare, a fork produces two projects which both
live on; typically each fork ends up catering to a different community.
GNU emacs was forked into xemacs, resulting in two successful projects.
OpenBSD was originally the result of a fork,
but it then specialized into being an operating system in which
“security was more important than almost anything else”,
resulting in a very successful project that has not eliminated the other BSDs.
Some people, such as Norm Petry, describe this kind of forking in
evolutionary terms: “this type of fork is
analogous to speciation, where each resulting species succeeds by
filling its own, distinct ecological niche.”
Too many forks can be a serious problem for all of the related projects.
In fact, one of the main reasons that Unix systems
lost significant market share compared to Windows was because of
the excessive number of Unix forks.
Bob Young states this quite clearly in this essay “Giving it Away”,
and also suggests why this is unlikely to be
a problem in copylefted OSS/FS software:
The primary difference between [GNU/Linux and Unix]
is that Unix is just another proprietary binary-only ... OS [operating system].
The problem with a proprietary binary-only OS that
is available from multiple suppliers is that
those suppliers have short-term marketing pressures
to keep whatever innovations they make to the
OS to themselves for the benefit of their
customers exclusively.
Over time these “proprietary innovations” to each version of the
Unix OS cause the various Unixes to differ
substantially from each other.
This occurs when the other vendors do not have access to the source code
of the innovation and the license the Unix vendors use prohibit the use
of that innovation even if everyone else
involved in Unix wanted to use the same innovation.
In Linux the pressures are the reverse. If one
Linux supplier adopts an innovation that becomes
popular in the market, the other Linux vendors will
immediately adopt that innovation.
This is because they have access to the source code of that innovation and it
comes under a license that allows them to use it.
Note that the copylefting licenses (such as the GPL and LGPL) permit forks,
but greatly reduce any monetary incentive to create a fork.
Thus, the project’s software licensing approach impacts
the likelihood of its forking.
The ability to create a fork is important in OSS/FS development,
for the same reason that the ability to call for a
vote of no confidence or a labor strike is important.
Fundamentally, the ability to create a fork forces project leaders to
pay attention to their constituencies.
Even if an OSS/FS project completely dominates its market niche,
there is always a potential competitor to that project:
a fork of the project.
Often, the threat of a fork is enough to cause project leaders to
pay attention to some issues they had ignored before, should those
issues actually be important.
In the end, forking is an escape valve that allows those who are
dissatisfied with the project’s current leadership
to show whether or not their alternative is better.
|
|
About the Author
David A. Wheeler is an expert in computer security and has
a long history of working with large and high-risk software systems.
His books include
Software
Inspection: An Industry Best Practice (published by IEEE CS Press),
Ada 95: The Lovelace Tutorial (published by Springer-Verlag),
and the
Secure Programming
for Linux and Unix HOWTO (on how to create secure software).
Articles he’s written related to OSS/FS include
More than a Gigabuck:
Estimating GNU/Linux’s Size,
How to Evaluate Open Source
Software / Free Software (OSS/FS) Programs,
Comments on Open Source Software / Free Software (OSS/FS) Software Configuration Management (SCM) systems,
Make Your Open Source Software GPL-Compatible. Or Else, and
OSS/FS References.
Other security-related articles he’s written include
Securing Microsoft Windows (for Home and Small Business Users),
Software Configuration Management (SCM) Security,
and
Countering Spam Using Email Passwords.
Other articles he’s written include
The Most Important Software Innovations,
Stop Spam!,
and an article on
Fischer Random Chess (Chess960).
He has released software as well, including
flawfinder (a source code scanner for developing secure software by detecting vulnerabilities) and
SLOCCount (a program to measure source lines of code, aka SLOC).
Mr. Wheeler’s web site is at
http://www.dwheeler.com.
You may contact him using the information at
http://www.dwheeler.com/contactme.html
but you may not send him spam (he reserves the right to charge fees
to those who send him spam).
|

|

|
You may reprint this article (unchanged) an unlimited number of times
and distribute local electronic copies (e.g., inside an organization or
at a conference/presentation),
as long as the article is provided free of charge to the recipient(s).
You may also quote this article, as long as the quote is clearly identified
as a quote and you attribute your quote with the article title, URL,
and my name (be sure to use my middle initial, “A.”).
You may not “mirror” this document to the public Internet or other
public electronic distribution systems;
mirrors interfere with ensuring that
readers can immediately find and get the current version of this document.
Copies clearly identified as old versions, not included in normal
searches as current Internet data, and for which there is no
charge (direct or indirect)
for those allowed access are generally fine; examples of acceptable copies are
Google caches and the Internet archive’s copies.
Please contact me
if you know of missing information, see something that needs fixing
(such as a misspelling or grammatical error),
or would like to translate this article to another human language.
Translators: I would love to see more freely-available translations
of this document,
and I will help you coordinate with others who may be translating the document
into that language.
Trademarks are registered by various organizations, for example,
Linux(r) is a trademark of Linus Torvalds.
This is a personal essay and not endorsed by my employer;
many people have found it useful, though.
This article is a research article, not
software nor a software manual.
|